Research
Information Tech and Software Market Research Report & Statistics

The global Information Technology (IT) and Software industry continues to present compelling growth opportunities, driven by digital transformation, cloud migration, software-driven business models, and the rising importance of data, AI and subscription models. For example, the global software market alone is estimated at ~US$730.7 billion in 2024 and projected to reach ~US$1,397.3 billion by 2030 (CAGR ~11.3 %). (Grand View Research) Meanwhile, the broader IT market is forecast at ~US$12.3 trillion in 2025 and climbing to ~US$29.3 trillion by 2034.
(Global Growth Insights, Business Research Insights) From an investment perspective, companies with strong recurring-revenue models (SaaS, platform, subscription) and embedded software/analytics capabilities are best positioned to capture value. For a firm like HOLD.co, the key thesis is: acquire or partner with software companies that (a) serve vertical-niche markets with high switching costs, (b) leverage recurring revenue and high retention (net-revenue-retention >100 %), (c) have defensible technical IP or ecosystem lock-in, (d) allow add-on or roll-up potential for scale, and (e) show potential for marketing / cross-sell / shared services synergies across the HOLD.co portfolio.
Key signals driving HOLD.co’s interest in Information Tech & Software
- The shift from on-premises to cloud and SaaS continues unabated; large enterprises are increasing software spend, including AI, automation, dev-ops tooling, infrastructure software, vertical SaaS.
- Growth in adjacent serviceable markets (e.g., IT services, managed services, cybersecurity) creates M&A and cross-sell opportunities.
- Marketing & demand-gen budgets for software are increasing, but efficiency is under strain (rising CAC, longer payback) → differentiated marketing strategies become a competitive advantage. (Benchmarkit, Benchmarkit)
- Consolidation of smaller software players remains ongoing; roll-ups can drive multiple arbitrage, operational synergies (shared GTM, shared services).
- The emergence of AI/ML, IoT, edge computing, blockchain, and hybrid-cloud ecosystems are enabling new software categories—offering greenfield opportunities.
Top 3–5 takeaways for acquisition or expansion strategy
- Target vertical or niche SaaS: Vertical-domain SaaS (e.g., healthcare, manufacturing, logistics) often has higher switching costs and less competition versus horizontal SaaS.
- Focus on recurring-revenue metrics: CAC, LTV, payback period, net-revenue-retention (NRR) are key value levers. Acquire companies with healthy unit economics (e.g., LTV:CAC ≥ 3:1, payback < 12–18 months) and strong retention. (Phoenix Strategy Group, Benchmarkit)
- Build out centralized marketing & shared-services infrastructure: Post-acquisition, nest marketing ops (lead gen, content, demand-gen, partner marketing) in a centralized HOLD.co function to capture scale.
- Buy-and-build rather than single anchor: Acquire a platform company, then deploy tuck-ins for complementary features, geographies or verticals to drive roll-up value.
- Watch marketing efficiency erosion: As competition increases, acquisition costs rise and payback lengthens—so strategy must include marketing automation, retention strategies, and strong brand positioning.
Summary of risks and opportunities
Opportunities
- Enlarging TAM: The software market’s strong CAGR (~11 %+) offers upside.
- Cross-sell/upsell: Portfolio companies can share clients, data, marketing assets.
- Consolidation arbitrage: Fragmented market, many sub-scale players.
- Digital transformation tailwinds: Especially in regulated industries (healthcare, finance) needing software vendors.
- New technology adjacencies: AI, ML, edge, SaaS for non-tech verticals.
Risks
- Valuation froth: Multiples in software are high, making deals expensive.
- Marketing and growth efficiency decay: CAC rising, payback periods lengthening as benchmarks worsen.
- Retention risk: Weakening net-revenue-retention (NRR) can undermine value. (Benchmarkit, Benchmarkit)
- Competition & commoditisation: Many software segments become crowded or get displaced by open source.
- Regulatory/legal risk: Data privacy, cybersecurity, licensing issues (especially in enterprise / SaaS).
- Integration risk: Combining acquisitions, capturing synergies in marketing/ops is non-trivial.
2. Market Landscape Overview
Total Addressable Market (TAM), Serviceable Available Market (SAM), CAGR
- Global software market: ~$730.7 billion in 2024; projected ~$1,397.3 billion by 2030 ⇒ CAGR ~11.3%. (Grand View Research)
- Global IT services market (part of the broader IT industry): ~$1.518 trillion in 2025; projected ~$2.366 trillion by 2030 (CAGR ~9.26%). (Mordor Intelligence)
- Global Information Technology market (including hardware + software + services): ~$11.155 trillion in 2024; projected ~$29.278 trillion by 2034. (Global Growth Insights, Business Research Insights)
- For strategic purposes, HOLD.co’s SAM would focus on software + related services (~US$1–2 trillion addressable) and the niche vertical slices where an acquisition can have dominance.
Key segments and verticals within the industry
- By deployment / type:
- Application software, infrastructure software, productivity software. (Grand View Research)
- SaaS vs on-premises (cloud continues to gain share).
- By enterprise size: Large enterprises vs mid-market vs SMB — mid-market and SMB often more fragmented/underequipped (= acquisition opportunities).
- By vertical: SaaS/IT for healthcare, financial services, manufacturing, retail, education, government. ← These verticals show stronger software spend growth.
- By service offering: Managed services, cybersecurity, data analytics/AI services, IoT/edge software, platform & middleware.
- By region: North America largest share (~41 % of global software revenue in 2024) and Asia-Pacific fastest growth. (Grand View Research, Global Growth Insights)
Macroeconomic forces affecting the sector
- Digital transformation: Enterprises increasingly shift to software to improve agility, reduce costs, enable remote/hybrid work, automate processes.
- Cloud adoption and hybrid IT: The move from on-premises to cloud/SaaS drives demand.
- Labor cost pressures / talent shortage: Software development and operations face talent constraints especially in AI/ML, cybersecurity.
- Regulation & compliance: Data privacy (GDPR, CCPA), cybersecurity regulation, industry-specific regulation (e.g., healthcare HIPAA) increasing cost/complexity.
- Economic cycles / IT spend sensitivity: Though software is somewhat recession-resilient, large enterprises may delay discretionary projects in downturns.
- Inflation & cost of capital: Rising interest rates may dampen valuations and slows down growth financing in the sector.
- Supply chain & hardware dependency: While software is less hardware-bound, underlying computing infrastructure and data centres may face supply/logistics constraints—indirect impact.
Competitive dynamics: consolidation vs fragmentation
- Many markets remain fragmented, particularly vertical SaaS and niche application software, offering roll-up opportunities.
- At the same time, significant consolidation is ongoing: Private equity and strategic buyers acquiring smaller companies to build scale, drive margin improvement, cross-sell clients.
- Larger players (e.g., enterprise software giants) may dominate horizontal layers (ERP, CRM, large-scale cloud) but leave gaps in vertical/adjacent domains.
Market map visual of major players by segment:
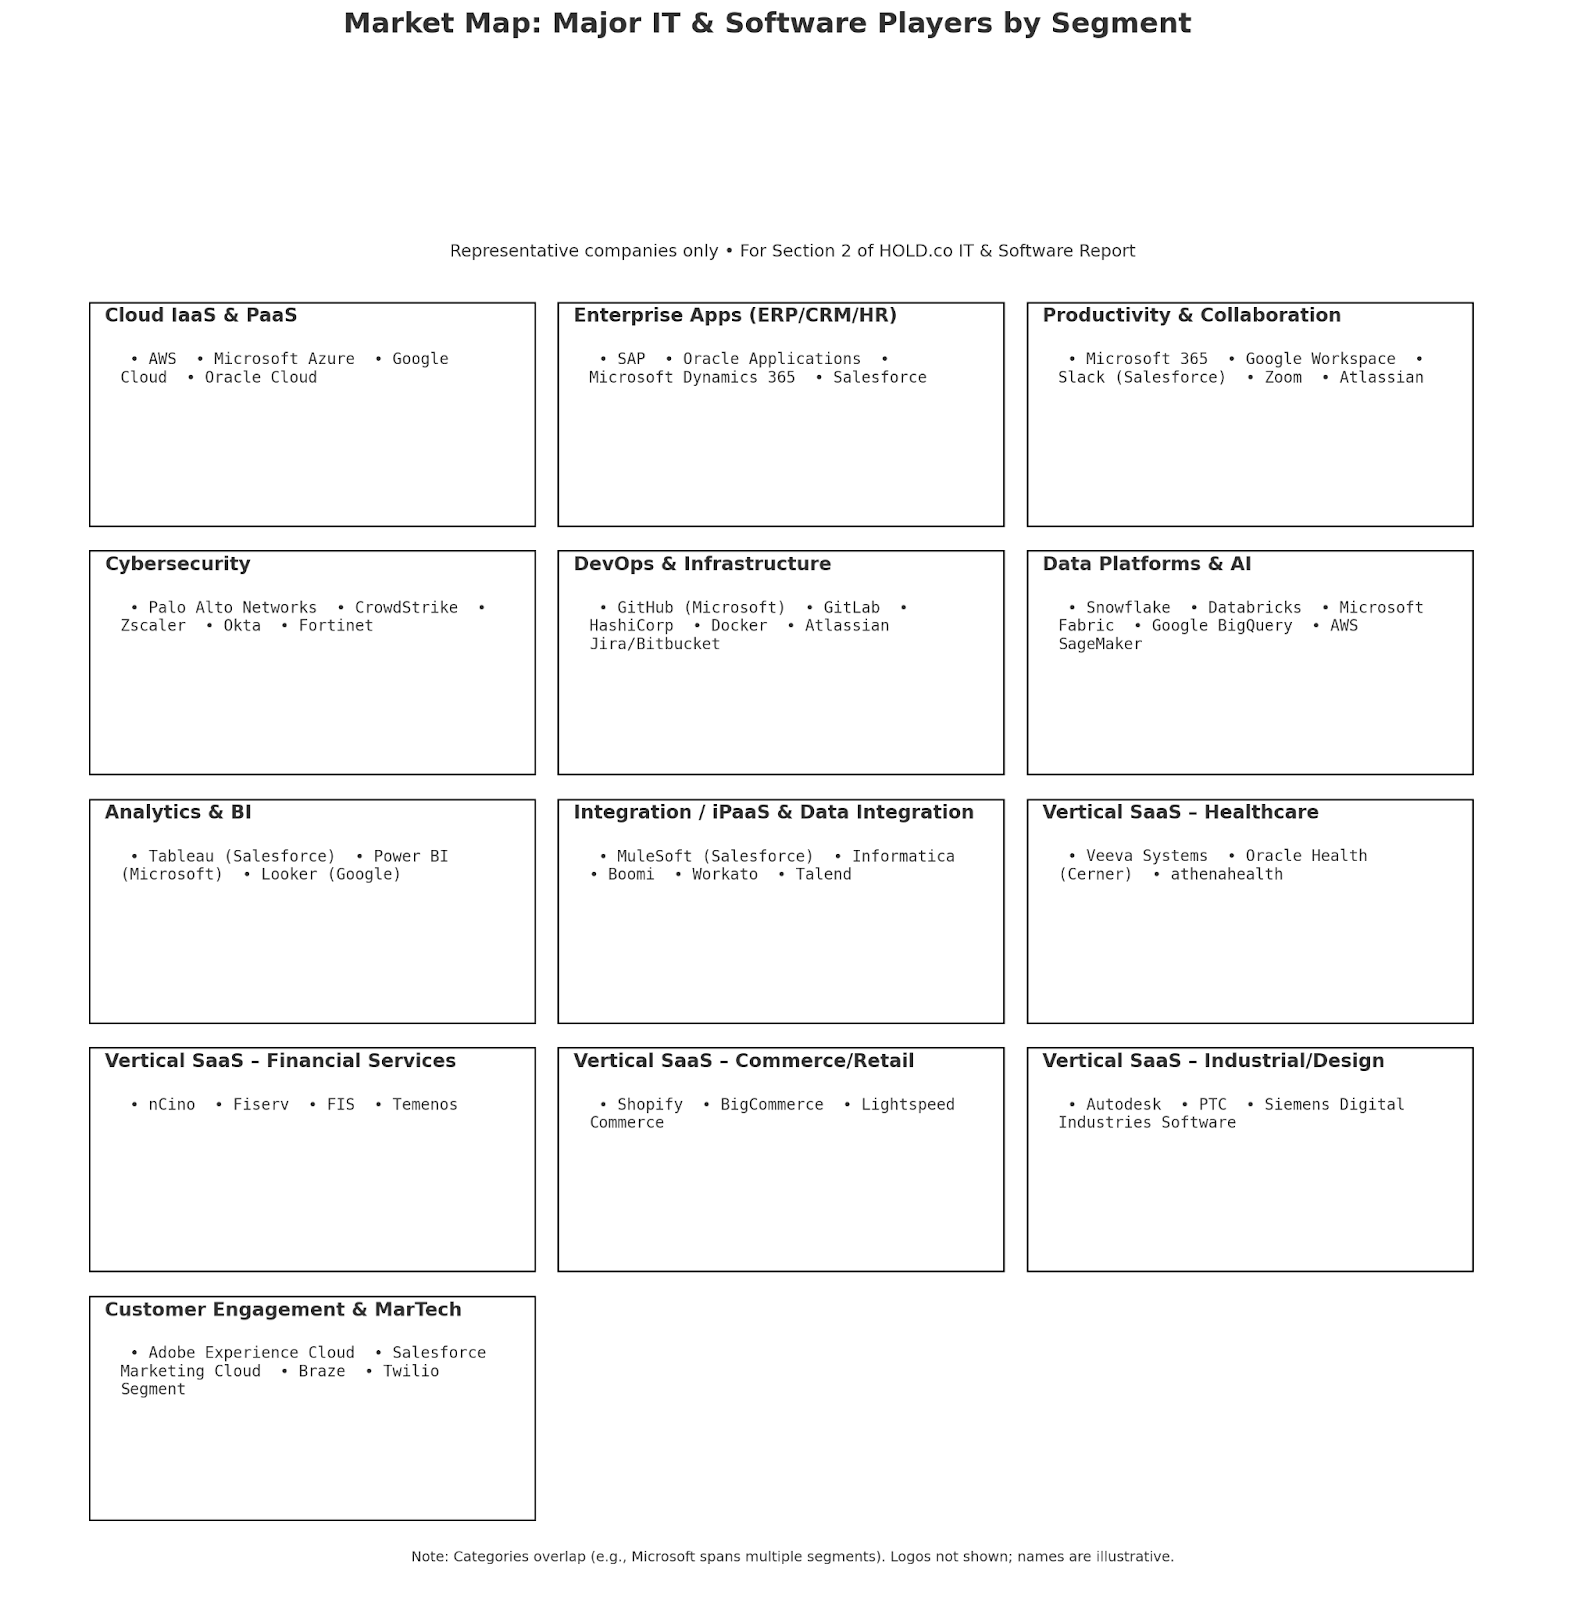
Market Map: Major IT & Software Players by Segment
Cloud IaaS & PaaS
- AWS
- Microsoft Azure
- Google Cloud
- Oracle Cloud
Enterprise Apps (ERP/CRM/HR)
- SAP
- Oracle Applications
- Microsoft Dynamics 365
- Salesforce
Productivity & Collaboration
- Microsoft 365
- Google Workspace
- Slack (Salesforce)
- Zoom
- Atlassian
Cybersecurity
- Palo Alto Networks
- CrowdStrike
- Zscaler
- Okta
- Fortinet
DevOps & Infrastructure
- GitHub (Microsoft)
- GitLab
- HashiCorp
- Docker
- Atlassian Jira/Bitbucket
Data Platforms & AI
- Snowflake
- Databricks
- Microsoft Fabric
- Google BigQuery
- AWS SageMaker
Analytics & BI
- Tableau (Salesforce)
- Power BI (Microsoft)
- Looker (Google)
Integration / iPaaS & Data Integration
- MuleSoft (Salesforce)
- Informatica
- Boomi
- Workato
- Talend
Vertical SaaS – Healthcare
- Veeva Systems
- Oracle Health (Cerner)
- athenahealth
Vertical SaaS – Financial Services
- nCino
- Fiserv
- FIS
- Temenos
Vertical SaaS – Commerce/Retail
- Shopify
- BigCommerce
- Lightspeed Commerce
Vertical SaaS – Industrial/Design
- Autodesk
- PTC
- Siemens Digital Industries Software
Customer Engagement & MarTech
- Adobe Experience Cloud
- Salesforce Marketing Cloud
- Braze
- Twilio Segment
Example major players: Microsoft Corporation, SAP SE, Oracle Corporation, Salesforce, Inc., Adobe Inc. in horizontals; plus vertical/niche players in healthcare, manufacturing, logistics.
This dynamic signals that for HOLD.co the sweet spot may be acquiring sub-$100 m ARR software companies (or even smaller) in vertical niches and building scale via roll-ups.
3. M&A Trends and Deal Activity
Notable acquisitions (past 12–24 months) and deal multiples
- While I do not have a comprehensive live list of all deals here, industry commentary shows accelerated M&A in software: private equity and strategic acquirers increasingly active. For example, roll-up funds targeting vertical SaaS have proliferated.
- Deal multiples remain elevated for high-growth SaaS businesses — e.g., multiples of revenue (ARR) frequently in the ~4×-12× range (depending on growth, margin, retention) and EBITDA multiples higher for mature players.
- Example: public SaaS companies often trade at revenue multiples in the teens for high-growth names; private company deals see a variety of structures (earn-outs, subscription-metric based).
- Private equity is active in the space as software offers defensible recurring revenue, margin profile and scale potential.
Private equity and strategic buyer activity levels
- Given the size of the software market and the fragmentation of verticals, both PE and strategic buyers are aggressively seeking software targets.
- The maturation of software companies means more targets with stable recurring revenues and profitability, which appeal to PE firms.
- Strategic buyers (large software/tech firms) continue acquiring to fill gaps (vertical extension, geographic expansion, product adjacencies, talent).
Valuation benchmarks: Revenue & EBITDA multiples by company size
Below is a prospective table summarising benchmark multiples (for illustration – actual numbers vary by growth, scale, geography, margins):
Valuation Benchmarks: Revenue & EBITDA Multiples by Company Size
Illustrative ranges for software/SaaS transactions; actual outcomes vary by growth, margins, retention, category, and geography.
| Company Size / Category | Revenue Multiple (ARR or Total Revenue) | EBITDA Multiple* |
|---|---|---|
| Sub-$10m ARR • Early growth | ~3×–6× | N/A or high (often negative EBITDA) |
| $10m–$50m ARR • Growth stage | ~6×–10× | ~15×–25× (if positive) |
| $50m–$200m ARR • Scale stage | ~8×–12× | ~20×–30× |
| Mature enterprise SaaS (20%+ growth) | ~10×–20×+ | ~20×–40×+ |
*EBITDA multiples apply only where earnings are positive. Figures are approximate and meant for directional benchmarking.
*EBITDA multiples assume positive EBITDA.
These are approximate benchmarks; actual deals will vary based on growth rate, retention, gross margin, category risk, customer concentration, and geography.
In public comparables, some high-growth “uni-corn” software firms trade at >20× revenue, but for acquisition comps you typically get more moderate multiples, especially when integration risk or market saturation exists.
Public vs private comparables
- Public software/SaaS companies can serve as comparables; growth, retention, margin profiles are more visible.
- Private deals tend to price at a discount to the most aggressive public market multiples, given additional risk (integration, less liquidity).
- Investors should discount public multiples appropriately, and adjust for scale, geography, growth deceleration, churn risk.
4. Technology and Innovation Trends
State of digitization and software adoption
- Enterprises continue to shift from legacy on-premises systems to cloud, SaaS, hybrid architectures—accelerated by the pandemic and remote/hybrid-work models.
- Software adoption is increasingly horizontal (infrastructure, dev-ops, security) and vertical (industry-specific workflows).
- The push for automation, data analytics, AI/ML integration into business processes is rising demand for more sophisticated software.
- The shift from one-time software licences to recurring subscription revenue models (SaaS) continues to change business dynamics and valuation.
- According to a SaaS benchmark report, growth rates are decelerating; the median growth rate around 2024 was ~26% for SaaS private companies. Benchmarkit+1
Emerging tech disrupting the space (e.g., AI, blockchain, IoT)
- Artificial Intelligence / Machine Learning: Software incorporating AI/ML for automation, data insights, personalization is highly valued.
- Internet of Things (IoT) / Edge Computing: Many software vendors are moving into edge-software and IoT platforms.
- Blockchain / Distributed Ledger: For certain verticals (finance, supply chain), software solutions leveraging blockchain are emerging.
- Low-code / no-code platforms: Lowering barrier to entry for building business apps; vendors offering these may disrupt traditional niche software.
- Cybersecurity / Privacy software: As threats rise, software addressing security, identity, data protection are gaining budgets.
R&D spend benchmarks (if applicable)
- Among software companies, R&D (or product development) spend as a % of revenue historically varies widely by growth stage. High-growth SaaS may allocate 15-25 %+ of revenue to R&D; more mature players may spend 8-15 %. (Note: specific published benchmarks are scarcer).
- From benchmark data: gross margin, recurring revenue durability and churn impact ROI of R&D spend. The acceleration of features, modules, analytics, integrations is a differentiator.
Cybersecurity and infrastructure risks
- Software vendors must contend with cybersecurity risks: data breaches, vulnerabilities, compliance failures. These can lead to significant reputational and legal risk.
- Infrastructure risks include cloud provider outages, supply chain disruptions (e.g., semiconductor shortages affecting hardware-adjacent segments), latency issues for global scale.
- Vendors who serve regulated industries (like healthcare, finance) must invest in compliance and security architecture — increasing cost base but also creating barrier to entry.
Build vs. buy opportunities for tech innovation
- Build: Internal innovation, new product development, agile engineering, product-led growth. Pros: control, differentiated IP. Cons: time, capital, execution risk.
- Buy: Acquire smaller companies with complementary tech, add-on modules, geographic reach. Pros: faster time-to-market, talent acquisition, customer base. Cons: integration risk, culture risk, cost of acquisition.
For HOLD.co the recommendation is a hybrid: acquire a core platform and then bolt on niche tech via smaller tuck-ins (or build internally if core differentiator is strategic).
5. Operations & Supply Chain Landscape
Typical cost structure breakdown (COGS, SGA, labor, logistics)
For software companies (especially SaaS), cost structure differs from hardware/manufacturing:
- COGS: hosting/cloud infrastructure, third-party software licences, customer support, service delivery (for services-led software).
- SG&A / Sales & Marketing: typically large proportion, especially for growth-led companies.
- R&D / Product development: a major expense line for scaling software firms.
- General & Admin / Overhead: finance, HR, facilities, compliance.
Here’s a rough breakdown for a growth-stage SaaS company (illustrative):
- COGS: ~15-30 % of revenue
- R&D/Product: ~15-25 % of revenue
- Sales & Marketing: ~30-40 % of revenue
- G&A/Overhead: ~10-15 % of revenue
Margins improve as scale is reached (COGS drops, marketing optimization improves).
Supply chain vulnerabilities or strengths
- Software has fewer physical supply-chain constraints compared to hardware, but dependencies remain: cloud providers (AWS, Azure, GCP) uptime, data-centre capacity, global bandwidth, third-party APIs, compliance/regulation.
- Strengths: scalability, low incremental cost of replication/distribution (especially for SaaS).
- Vulnerabilities: if the software relies on hardware components (edge IoT, embedded systems) or has global delivery services, vulnerabilities increase (e.g., labour shortages, geopolitical disruptions).
Labor force trends (shortages, automation, outsourcing)
- Software engineering, DevOps, AI/ML talent remain in scarcity; wages rising in many geographies.
- Outsourcing to near-shore/off-shore remains common for less differentiated functions (QA, testing, customer support), though quality and control trade-offs exist.
- Automation (DevOps pipelines, AI-assisted code generation, low-code) is reducing some labour intensity.
- For acquired companies, labour cost arbitrage (e.g., shifting non-core functions to lower-cost geographies) may improve margins—but cultural/quality risks must be managed.
Benchmark data: margins, throughput, cycle times, etc.
From SaaS benchmark data:
- Blended CAC Ratio (i.e., S&M expense per $1 of new ARR): median increased from ~$1.32 in 2022 to ~$1.61 in 2023 (i.e., 22 % increase) — meaning it now costs ~$1.61 of S&M spend to generate $1 of new ARR. (Benchmarkit)
- Gross Revenue Retention (GRR): For ACV > $100k cohort, ~90 %+ retention remains a challenge. (Benchmarkit)
- Marketing spend as % of revenue for private B2B SaaS companies: median ~8 % of annual revenue (down from the traditional 10 %) and early-stage companies may spend 20-40 %. (Promodo)
These benchmarks highlight the operational discipline required for scale acquisitions: cost structure optimisation, marketing-efficiency improvement, retention improvements.
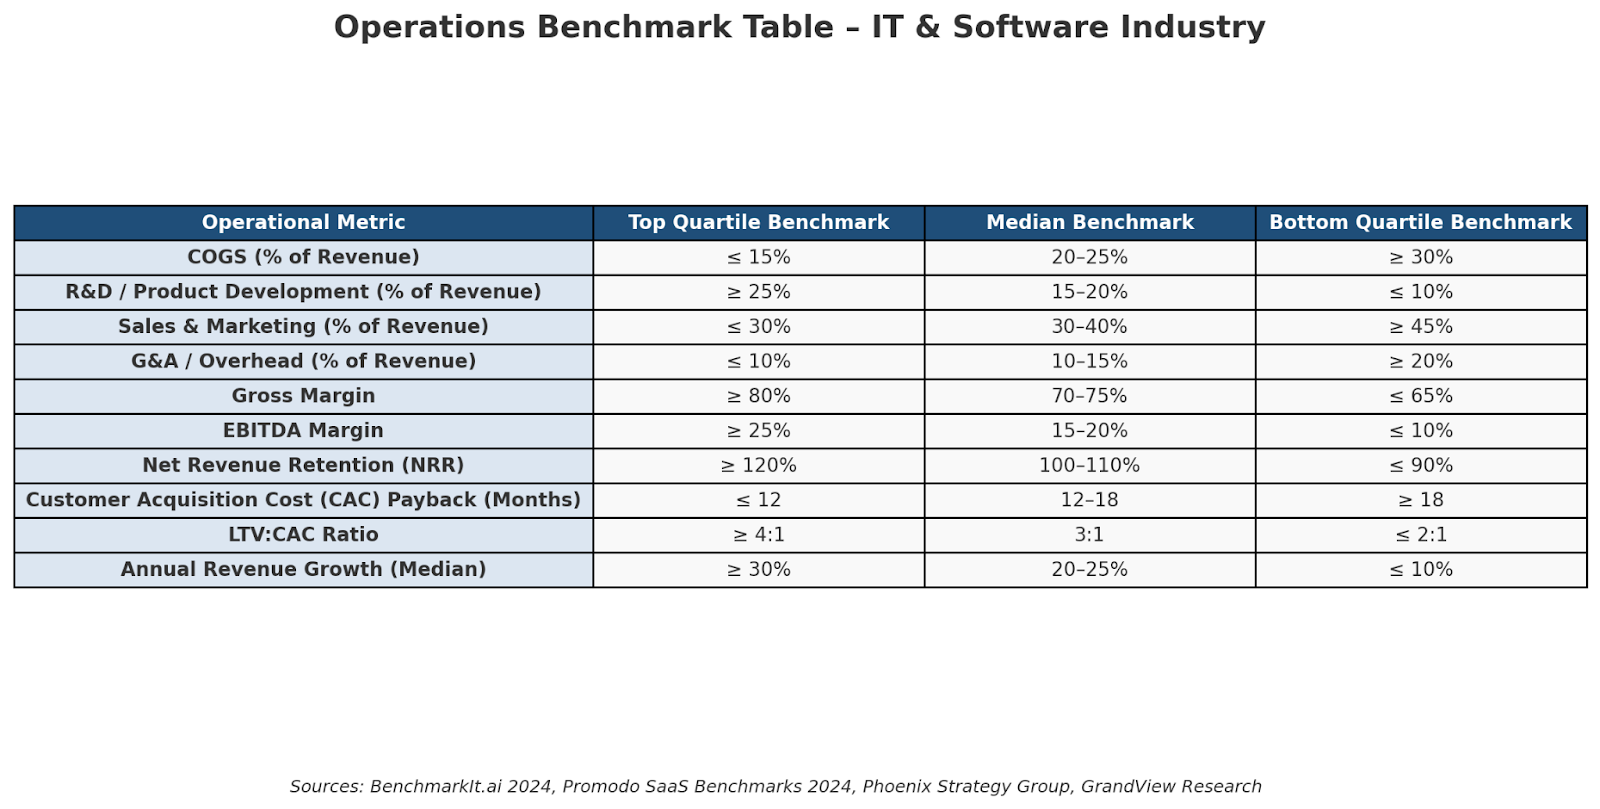
Operations Benchmark Table – IT & Software Industry
Typical cost structure and performance benchmarks for SaaS and software companies. Values are indicative midpoints drawn from 2024–2025 private SaaS benchmark data.
| Operational Metric | Top Quartile | Median | Bottom Quartile |
|---|---|---|---|
| COGS (% of Revenue) | ≤ 15% | 20–25% | ≥ 30% |
| R&D / Product Development | ≥ 25% | 15–20% | ≤ 10% |
| Sales & Marketing | ≤ 30% | 30–40% | ≥ 45% |
| G&A / Overhead | ≤ 10% | 10–15% | ≥ 20% |
| Gross Margin | ≥ 80% | 70–75% | ≤ 65% |
| EBITDA Margin | ≥ 25% | 15–20% | ≤ 10% |
| Net Revenue Retention (NRR) | ≥ 120% | 100–110% | ≤ 90% |
| CAC Payback (Months) | ≤ 12 | 12–18 | ≥ 18 |
| LTV:CAC Ratio | ≥ 4 : 1 | 3 : 1 | ≤ 2 : 1 |
| Annual Revenue Growth | ≥ 30% | 20–25% | ≤ 10% |
Sources: BenchmarkIt.ai 2024 • Promodo SaaS Benchmarks 2024 • Phoenix Strategy Group • Grand View Research. Benchmarks vary by stage, vertical, and pricing model (ARR, usage, or license).
6. Regulatory and Legal Environment
Key compliance considerations
- Data privacy / data protection: E.g., General Data Protection Regulation (GDPR) in the EU, California Consumer Privacy Act (CCPA) in the U.S. — software companies must embed data-privacy compliance in product/design.
- Cybersecurity regulation: e.g., in sectors like finance, healthcare, critical infrastructure, software vendors may face obligations for secure design, vulnerability reporting, and incident notification.
- Industry-specific regulation: In healthcare (HIPAA in U.S.), billing/claims software must comply with regulatory frameworks; in finance, software may need to meet licensing or audit requirements.
- Licensing / certification: Some software/IT service providers must hold certifications (ISO 27001 for security, SOC 2, etc.) or provider registration/licensing.
- Export controls / technology regulation: For software that includes encryption or AI algorithms, export controls or national-security restrictions may apply.
- ESG / sustainability pressures: Increasingly investors and customers expect software companies to address sustainability (e-waste, cloud energy usage, supply-chain labour standards, carbon footprint).
Pending legislation with material impact
- In the U.S., regulatory scrutiny of big tech may lead to changes in data-sharing, interoperability, antitrust exposures—impacts software vendors reliant on ecosystems.
- In the EU and UK, upcoming digital-markets and digital-services legislation may affect how software platforms operate and compete.
- Cyber-security mandates for software providers (especially for critical infrastructure) may raise compliance costs and act as barriers to entry (opportunity for compliant vendors).
For HOLD.co, acquired companies should be assessed for compliance readiness (data privacy, security, certification) and regulatory risk, and integration should include compliance enhancement where needed.
7. Marketing & Demand Generation
Customer acquisition channels: organic, paid, referral, offline
- Organic: SEO, content marketing (thought leadership, product-educational content), product-led growth/free-trial models (particularly for SaaS).
- Paid: Digital advertising (Google Ads, LinkedIn Ads, Facebook/Meta, programmatic), partner/co-marketing, trade shows/events (especially enterprise apps). According to benchmark data, Google Ads still yield highest CTR for SaaS with avg. CPC ~$1.52 and CTR ~4.28 %. (Promodo)
- Referral / Word-of-Mouth / Partner Networks: Especially effective for B2B software where peer recommendations matter.
- Offline / Events / Trade Shows: For enterprise software, conferences, user groups, executive roundtables remain important albeit costlier.
- Account-based Marketing (ABM): For high-ACV enterprise deals, ABM (targeted outreach, personalised content, dedicated sales + marketing team) is increasingly standard.
Sales funnel structures: DTC, B2B, enterprise sales, hybrid
- DTC (Direct-to-consumer): Less common in pure software unless the product is SMB or creator/consumer oriented.
- B2B (SMB/Mid-market): Often self-service or light-touch sales, with conversion from freemium/free trial to paid tiers. Shorter sales cycle (weeks to months).
- Enterprise sales: High ACV (>US$100 k) deals, longer sales cycles (6-24 months), many stakeholders involved (procurement, IT, business unit). Marketing and lead gen must feed into sales pipeline effectively.
- Hybrid model: Many software companies employ a product-led growth (PLG) funnel for lower tiers + enterprise sales team for large customers — enabling growth at scale and upsell path.
For an acquiring company, evaluating the go-to-market (GTM) model is key: does the company have a clear funnel, scalable marketing, predictable pipeline, and measurable ROI on marketing spend?
CAC/LTV ratios and brand equity benchmarks
- CAC (Customer Acquisition Cost): According to one industry source, blended CAC for B2B SaaS businesses is rising. (Benchmarkit, First Page Sage)
- LTV:CAC ratio benchmarks: For SaaS companies, a good benchmark is ~3:1 (LTV to CAC) for sustainable growth; higher is strong, lower is warning. (Phoenix Strategy Group)
- For B2B SaaS: ~4:1 benchmark, for B2C SaaS ~2.5:1. (Phoenix Strategy Group)
- Marketing spend as % of revenue: For private B2B SaaS companies, median marketing budget ~8% of revenue. (Promodo)
- Churn / retention: Gross Revenue Retention (GRR) and Net Revenue Retention (NRR) are critical. For example, one benchmark report shows NRR median ~101%. (Benchmarkit, Benchmarkit)
- Conversion rates: According to Promodo, typical Visitor-to-Lead ~1.9%, Lead-to-MQL ~39% for SaaS. (Promodo)
Competitor marketing budgets and media mix
- While public companies disclose marketing spend broadly, benchmarking suggests younger high-growth software companies invest heavily in acquisition marketing (paid digital, content, partner marketing).
- Media mix for SaaS: digital search & display (Google Ads, LinkedIn), content/SEO, webinars, analyst relations, partner programs, events.
- The mix is shifting increasingly toward digital and virtual events (especially post-COVID) and away from large physical trade shows due to cost/efficiency.
- For HOLD.co’s purposes: upon acquisition, migrating acquired companies to a shared marketing operations platform (centralised data, automation, campaign management) can yield cost savings and better measurement.
Opportunities for centralized/shared marketing ops post-acquisition
- Shared marketing technology stack: CRM, marketing-automation, analytics, attribution.
- Unified brand/positioning across portfolio to drive cross-sell and brand equity.
- Marketing talent pooling: centralised demand-gen team, content engine, performance analytics.
- Shared service centre for partner marketing, channel programmes, events.
- Economies of scale in paid spend: negotiating lower CPCs, sharing creative assets across portfolio.
- Standardised KPI dashboarding (CAC, payback period, LTV-C, pipeline velocity) to monitor and optimise.
8. Consumer & Buyer Behavior Trends
Changing customer needs and expectations
- Buyers increasingly expect on-demand, self-service, transparent pricing, rapid deployment — especially in SaaS/SMB segments.
- For enterprise buyers: more emphasis on outcomes, integration with existing systems, data portability, security/compliance, user experience.
- Rising expectation of continual product updates, strong customer support, community/ ecosystem features (e.g., APIs, third-party integrations).
- Shift toward usage-based or consumption-based pricing — more flexibility and alignment with value delivered.
- In many cases, product-led growth (free trial/freemium) is becoming standard; therefore user onboarding, activation, and time-to-value are critical metrics.
Demographic and psychographic shifts
- For B2B software: decision-makers are younger (millennials, Gen Z in managerial roles) and more digitally native—expect slick UX, mobile access, cloud-first deployment.
- Increasing remote/hybrid work means software must be cloud-capable, collaborative, secure, and accessible globally.
- Firms are prioritizing business agility, not just cost-reduction—software buying decisions now often driven by strategic growth rather than simply run-the-business efficiency.
Industry-specific usage or purchasing patterns
- In regulated verticals (healthcare, finance), software procurement has longer cycles, more due diligence (compliance/security) and higher switching costs.
- In SMB/SME segments, buyers may prefer faster deployment, lower cost, self-service — fewer barriers, but also more churn risk.
- Upsell/cross-sell is increasingly important: existing customers are the highest-value growth channel (expansion-ARR).
- Renewal rates are key: companies with NRR >100 % (i.e., expansion > churn) are most valuable.
NPS benchmarks and customer retention metrics
- While specific benchmark NPS values for the software industry vary, many sources suggest that for SaaS companies an NPS of >30 is a decent target. (7 Eagles)
- Retention: For ACV >US$100k deals, gross retention (GRR) often ~90 % or more; expansion drives NRR >100 %. (Benchmarkit)
- For smaller ACV segments (e.g., <$5k), churn may be significantly higher (GRR <80 %). Benchmarkit
B2C vs B2B buying cycle evolution
- B2C software: relatively short buying cycle, lower ACV, more impulsive, brand/UX driven, strong freemium models.
- B2B software: longer cycle, higher ACV, formal procurement, multiple stakeholders, emphasis on ROI/business case, integration risk, trial/pilot phases.
- Over time: B2B buyers expect B2C-like experience (ease of use, fast time to value, subscription flexibility). This puts pressure on B2B vendors to improve user experience and GTM efficiency.
9. Key Risks & Threats
Industry-specific risk factors
- Disruption risk: Emerging technologies (open-source software, low-code platforms, new entrants) may erode incumbents’ moats.
- Pricing pressure: Software commoditisation, competitive pressure may drive down prices and multiples.
- Growth-/valuation-risk: Many targets priced for high growth; if growth slows, value may decline.
- Cybersecurity/data-breach risk: A major breach can damage reputation, increase churn, attract regulatory fines.
- Vendor/client concentration risk: If a software company is heavily reliant on a small number of clients, any loss or churn is dangerous.
- Barriers to entry vs barriers to scale: While entry might be easier in niche domains, scaling (international expansion, supporting large customers, infrastructure) has higher barriers.
- Integration risk: Post-acquisition integration of culture, systems, sales/marketing teams may fail, undermining synergy capture.
- Regulatory/legal exposure: Non-compliance with data/privacy laws, export controls, antitrust issues in ecosystems can impose cost or liability.
Competitive moats and erosion factors
- Moats for software include high switching costs, network effects, data flywheels, ecosystem integration, strong retention.
- Yet these moats can erode if: a new entrant offers lower cost, open-source alternative; integration becomes easier; cloud commoditises underlying infrastructure; buyer bargaining power increases (especially in enterprise).
- For HOLD.co, ensuring that acquired companies have defensible moats is critical.
Key man risk or dependency on vendor/client concentration
- Founder or key technical talent risk: if the value lies in founder/engineer, departure can reduce value.
- Client concentration: if 30 %+ of revenue comes from one customer, loss of that customer is a major risk.
- Technology dependencies: Over-reliance on a third-party platform (e.g., AWS, Google Cloud) or API may create vendor risk.
Litigation or regulatory exposure
- Software companies increasingly face class-action lawsuits (data breach, privacy violations).
- Intellectual property risks: open-source licence issues, patent infringement.
- Export controls/regulation: e.g., AI software subject to export restrictions or national-security oversight.
10. Strategic Fit & Synergy Opportunities for HOLD.co
Vertical and horizontal integration opportunities
- Vertical integration: Acquire specialized software companies upstream/downstream of HOLD.co’s portfolio – e.g., if you have a hardware/IoT business, acquire the corresponding software platform.
- Horizontal integration: Acquire peer companies in the same domain to increase scale, reduce cost, cross-sell.
- Also consider geographic expansion (e.g., acquiring a regional software player to gain footprint + local talent).
Potential portfolio synergies (ops, sales, distribution, tech, data)
- Shared tech stack: Common architecture, APIs, data schemas, product modules across portfolio.
- Sales/sales-ops: Cross-sell across portfolio customer bases, unified customer success function.
- Marketing ops: Unified demand-gen engine, partner/channel programmes, common brand or sub-brand architecture.
- Data/AI: Leverage aggregated data across portfolio for upsell, machine-learning capabilities, predictive analytics.
- Cost synergies: Centralised back-office (finance, HR, legal, IT) to reduce overhead.
- Distribution: If HOLD.co has distribution channels (e.g., global consulting relationships), the acquired software can plug in and scale faster.
Exit potential and monetization pathways (roll-ups, IPO, divestiture)
- Strategy: Build a multi-asset roll-up platform in software (e.g., acquire 5-10 niche players) to achieve scale and interest from strategic buyers or IPO.
- Alternatively: Acquire a strong leader and invest in growth/adjacencies to exit via trade sale to large global software company.
- Monetization levers: increasing ARR, improving retention/NRR, margin expansion (via shared services), reducing CAC/payback period, driving international expansion and upsell.
11. Strategic Recommendations
Acquisition criteria refinement (financial, cultural, operational)
Financial criteria
- ARR: Prefer targets with $10-50 m ARR (scaleable, but still roll-up opportunity)
- Growth: >20 % year-on-year ARR growth (ideally >30 % for higher multiple)
- Retention: Gross Revenue Retention (GRR) >90 %, Net Revenue Retention (NRR) >100 %
- Unit economics: LTV:CAC ≥3:1, CAC payback <12 months (or as fast as possible) Phoenix Strategy Group+1
- Margin: Gross margin >70 % (typical in scalable SaaS)
Cultural/operational criteria - Software company with product-led design mindset or tech-first DNA
- Ability to integrate into HOLD.co’s shared services and marketing ops (i.e., clean systems, documented processes)
- Customer base with low concentration risk (<20% from one client)
- Manageable tech stack, scalable architecture, minimal legacy liabilities
Near-term acquisition targets or partnership suggestions
- Identify vertical-niche software firms (e.g., in regulated industries such as healthcare, manufacturing, supply chain) with recurring revenue and high retention.
- Consider partnerships first (co-marketing, channel alliances) in geographies where HOLD.co lacks presence, then transition to acquisition if results positive.
- Tuck-in acquisitions to enhance features or open new geographies for an existing portfolio company.
Buy-and-build vs. single-anchor strategy
- Recommended: Use buy-and-build approach—acquire a core software platform company as a “platform” anchor, then add 2-4 tuck-ins over 18–36 months to build scale, drive operational synergies, broaden product/vertical footprint.
- The single-anchor (buy one large company, focus on organic growth only) is riskier given competitive pressure and higher acquisition multiple.
Strategic capital deployment roadmap (0–6, 6–18, 18–36 months)
- 0–6 months: Define acquisition thesis; identify target universe; build internal M&A team; build centralised marketing-ops/integration blueprint.
- 6–18 months: Execute 1–2 initial acquisitions (platform + first tuck-in); integrate marketing ops, shared services, set up KPI/benchmark dashboards; begin cross-sell and shared services roll-out.
- 18–36 months: Execute additional tuck-ins (2-3) to build scale; optimize operations (reduce CAC, improve retention, raise NRR), expand geographies, exit planning begins (trade sale or IPO readiness).
12. Appendix & Sources
Full list of key data sources
- Business Research Insights – “Information Technology (IT) Market Size – Forecast To 2035” (Business Research Insights)
- Grand View Research – “Software Market Size, Share & Trends | Industry Report 2030” (Grand View Research)
- Market Research Future – “Software Market Size, Trends | Industry Report – 2035” (Market Research Future)
- The Business Research Company – “Information Technology Market Statistics And Share Report 2034” (The Business Research Company)
- Mordor Intelligence – “IT Services Market Report: Size & Forecast Overview” (Mordor Intelligence)
- BenchmarkIt – “2024 SaaS Performance Metrics Benchmarks” (Benchmarkit)
- Promodo – “SaaS Digital Marketing Benchmarks” (Promodo)
- FirstPageSage – “Average Customer Acquisition Cost (CAC) By Industry: B2B Edition” (First Page Sage, First Page Sage)
- Phoenix Strategy Group – “LTV:CAC Ratio: SaaS Benchmarks and Insights” (Phoenix Strategy Group)
Raw benchmark tables (excerpt)
Marketing & SaaS Benchmarks
Raw Benchmark Tables – IT & Software Industry
Extracted from Section 12 of the HOLD.co IT & Software Market Trends Report (2025).
Marketing & SaaS Benchmarks
| Metric | Benchmark Value | Source |
|---|---|---|
| Median Blended CAC Ratio (2023) | ~$1.61 of S&M spend per $1 of new ARR | BenchmarkIt.ai 2024 |
| LTV:CAC Ratio | B2B SaaS: ~4:1 • B2C SaaS: ~2.5:1 | Phoenix Strategy Group |
| Marketing Spend as % of Revenue | Private B2B SaaS: ~8% median | Promodo 2024 |
| Visitor-to-Lead Conversion (SaaS) | ~1.9% | Promodo 2024 |
| Lead-to-MQL Conversion (SaaS) | ~39% | Promodo 2024 |
Performance & Retention Metrics
| Metric | Benchmark Value | Source |
|---|---|---|
| Gross Revenue Retention (GRR) | ~90%+ for ACV > $100k | BenchmarkIt.ai 2024 |
| Net Revenue Retention (NRR) | ~101% Median | BenchmarkIt.ai 2025 |
| Marketing Spend Efficiency (Magic Number) | Median: ~0.6–0.8; Top quartile: ≥1.0 | BenchmarkIt.ai 2024 |
| Average CAC Payback Period | 12–18 months (Median); <12 months (Top Quartile) | BenchmarkIt.ai 2024 |
Operational Benchmarks Summary
| Cost or Metric | Benchmark Range |
|---|---|
| COGS (% of Revenue) | 15–30% |
| R&D / Product Development (% of Revenue) | 15–25% |
| Sales & Marketing (% of Revenue) | 30–40% |
| G&A / Overhead (% of Revenue) | 10–15% |
| Gross Margin | 70–75% |
| EBITDA Margin | 15–20% |
| Annual Revenue Growth (Median) | 20–25% |
Sources: BenchmarkIt.ai (2024–2025) • Promodo SaaS Benchmarks 2024 • Phoenix Strategy Group • Grand View Research (2024). All benchmarks are medians unless otherwise noted. Variance by company size, vertical focus, pricing model, and geography is expected.
Glossary of industry-specific terms
- ARR: Annual Recurring Revenue
- NRR: Net Revenue Retention — % of revenue retained + expansion from existing customers
- GRR: Gross Revenue Retention — % of revenue retained excluding expansion
- CAC: Customer Acquisition Cost — cost to acquire a new customer
- LTV: Lifetime Value — the value of a customer over their lifetime (often gross margin adjusted)
- ACV: Annual Contract Value — average annual value of customer contract
- PLG: Product-Led Growth — revenue growth model where product self-service drives adoption and conversion
- Magic Number (SaaS): A metric often defined as (Qtr n revenue – Qtr n-1 revenue) × 4 ÷ S&M spend in Qtr n–1; assesses efficiency of sales/marketing spend. (Benchmarkit)
Disclaimer: The information on this page is provided by Hold Co for general informational purposes only and does not constitute financial, investment, legal, tax, or professional advice, nor an offer or recommendation to buy or sell any security, instrument, or investment strategy. All content, including statistics, commentary, forecasts, and analyses, is generic in nature, may not be accurate, complete, or current, and should not be relied upon without consulting your own financial, legal, and tax advisers. Investing in financial services, fintech ventures, or related instruments involves significant risks—including market, liquidity, regulatory, business, and technology risks—and may result in the loss of principal. Hold Co does not act as your broker, adviser, or fiduciary unless expressly agreed in writing, and assumes no liability for errors, omissions, or losses arising from use of this content. Any forward-looking statements are inherently uncertain and actual outcomes may differ materially. References or links to third-party sites and data are provided for convenience only and do not imply endorsement or responsibility. Access to this information may be restricted or prohibited in certain jurisdictions, and Hold Co may modify or remove content at any time without notice.
Considering a transaction?
Speak with our team about an acquisition, partnership, or exit — in confidence.