
The global Health Care / MedTech sector is entering a steadier, data-driven growth phase. Industry revenues reached roughly US$588B in 2023 (about 8.3% CAGR since 2019), with expansion now powered less by post-pandemic whiplash and more by durable structural forces: rapid population aging, a rising chronic-disease burden, and an accelerating wave of software and AI features embedded into devices and workflows. Hospitals’ operating performance improved in early 2025—supporting near-term purchasing capacity—even as cost pressures persist. EY World Health Organization Boston Consulting Group Healthcare Dive
At the same time, buying and marketing dynamics are shifting. Provider procurement teams and value analysis committees (VACs) are shortlisting fewer vendors and demanding clearer clinical and economic proof—forcing go-to-market motions to emphasize outcomes, total cost of care, and post-sale support over feature lists. Policy tailwinds for hybrid/virtual care continue to stimulate device-enabled care models and remote monitoring adjacencies. Meanwhile, privacy-driven signal loss and the deprecation of third-party cookies are pushing MedTech marketers toward first-party data, brand-led growth, reviews, and compounding organic channels. offers.premierinc.com symplr Centers for Medicare & Medicaid Services telehealth.hhs.gov EMARKETER
High-level market outlook & investment thesis
Global and U.S. demand fundamentals are strengthening into 2025–2033, driven by aging populations, chronic-disease burden, and accelerating software/AI adoption in devices and care delivery. U.S. national health expenditures (NHE) are projected to grow ~5.8% annually (2024–2033), pushing health spend from 17.6% of GDP (2023) to 20.3% by 2033, with total dollars reaching about $8.6T—a durable demand backdrop for MedTech platforms and digital health infrastructure. Centers for Medicare & Medicaid Services Health System Tracker
MedTech revenue growth has been steady post-pandemic (≥4% in each of the past eight years), profitability recovered in 2023 (though still ~9% below pre-COVID levels), and R&D intensity remains 5–6% of revenue—signaling an industry that can fund innovation even in mixed macro conditions. EY
Regulatory clarity is improving: the FDA’s 2025 draft guidance outlines lifecycle and marketing-submission expectations for AI-enabled device software, and the EU extended MDR transition timelines and scrapped “sell-off” deadlines—both easing go-to-market risk for software-heavy devices and sustaining legacy product revenue tails. U.S. Food and Drug Administration Public Health
Capital is stabilizing in digital health: H1 2025 US venture funding reached $6.4B across 245 deals (up from $6.0B in H1-2024 and $6.2B in H1-2023), suggesting a floor with selective appetite for real-world-evidence (RWE), AI-assisted diagnostics, and workflow automation. Rock Health+1
Thesis: For HOLD.co, a buy-and-build in MedTech/software-enabled care platforms can compound value by consolidating fragmented niches with sticky provider integrations and reimbursement pathways, layering in shared GTM/demand gen, and accelerating software/AI roadmaps under converging FDA/EU frameworks. (See “Top takeaways” below.)
Chart — US Digital Health Venture Funding (H1) (Rock Health)
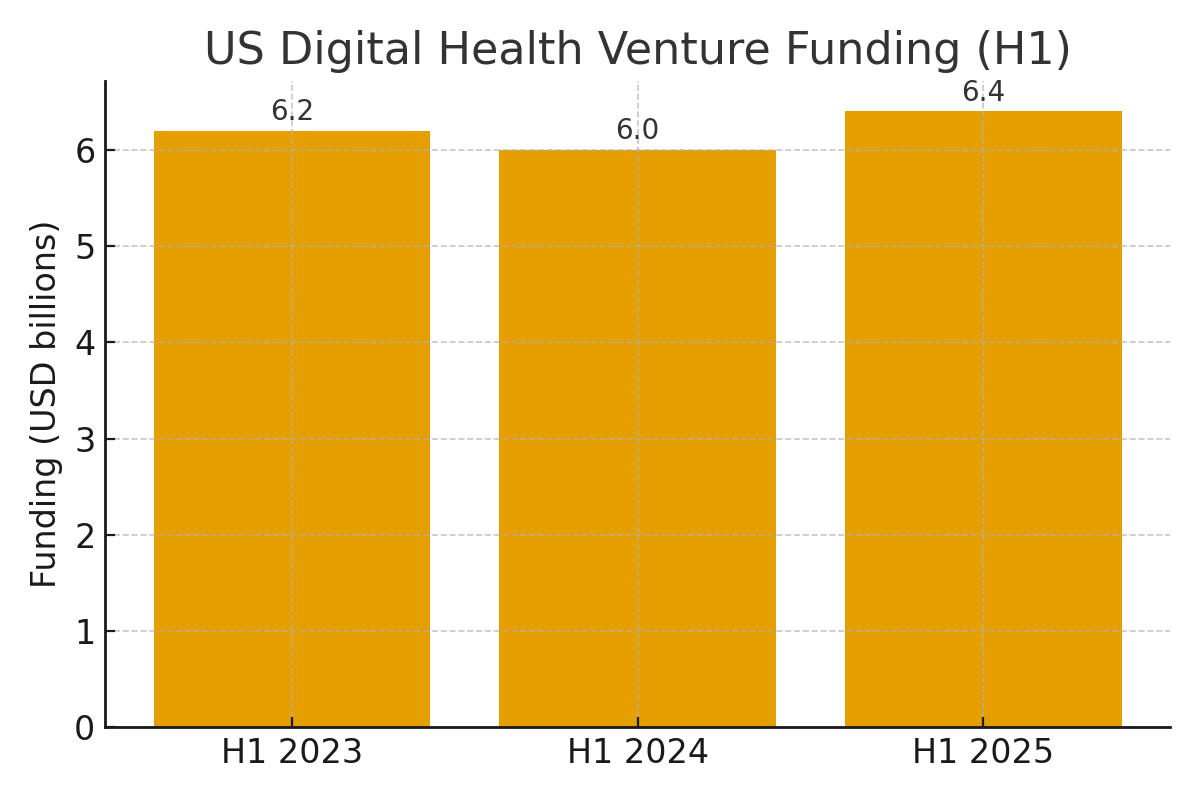
Sources: Rock Health H1-2025 overview and weekly update. Rock Health+1
Chart — US Health Spending Trajectory
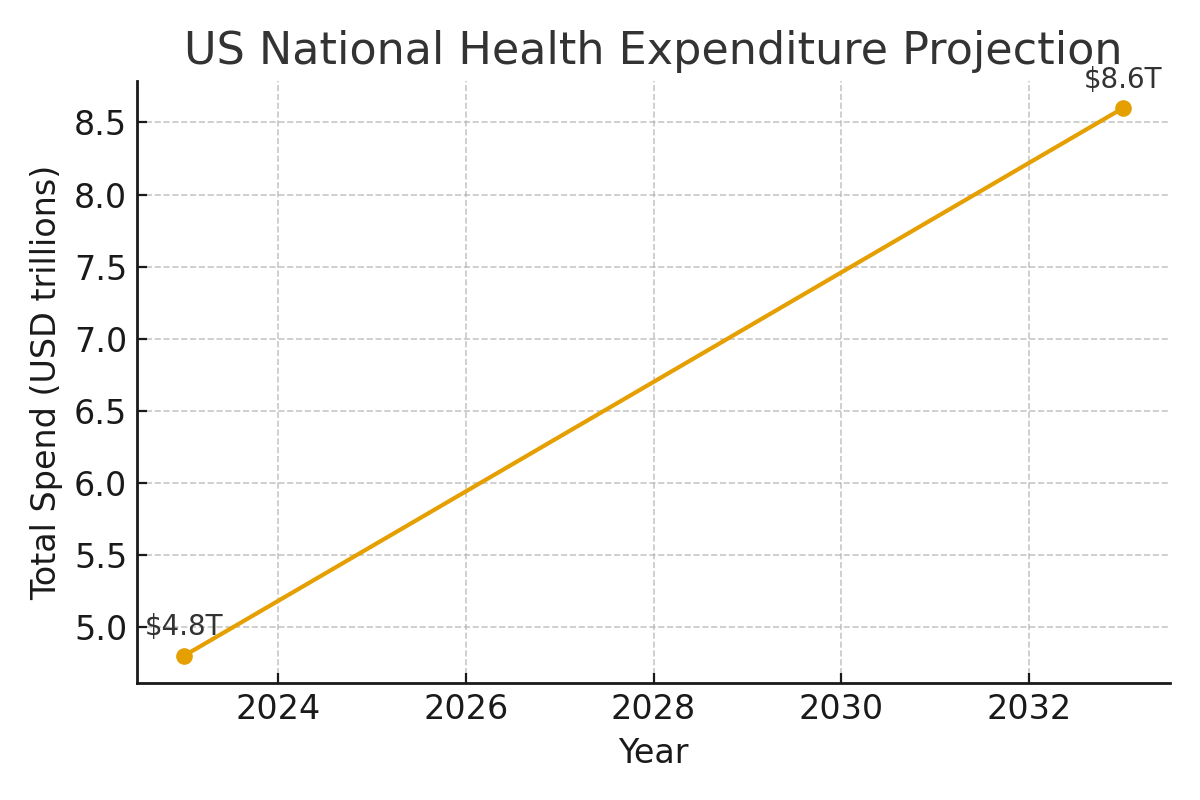
Sources: CMS Office of the Actuary; KFF/Health System Tracker summary. Centers for Medicare & Medicaid Services Health System Tracker
Key signals driving HOLD.co’s interest in Health Care / MedTech
- Secular dollar growth: NHE growth outpaces GDP through 2033; Medicare/Govt financing share rises—supportive of reimbursed device/procedure volumes and data-driven service models. Centers for Medicare & Medicaid Services
- Demographic pull: OECD 65+ cohort rises toward ~27% by 2050 (vs. 18% in 2021), expanding cardiovascular, ortho, neuro, and diagnostics end-markets. OECD
- Regulatory tailwinds for software/AI & evidence: FDA 2025 AI draft guidance; accelerating acceptance of RWE in device decisions and coverage (e.g., CMS CED, TCET pilots). U.S. Food and Drug Administration IQVIA
- Marketing budget resilience: US health/Pharma ad spend surpasses $30B (2024), with gradual mix shift to digital & performance—useful for centralized demand generation post-acquisition. EMARKETER
- Capital markets thaw (selectively): Digital health funding stabilizes; healthcare PE/ M&A shows mixed but improving signals vs. 1H-2024, with optimism for larger transactions as macro/antitrust risk moderates. Rock Health Bain Reuters
Top 3–5 takeaways for acquisition or expansion strategy
- Prioritize software-centric MedTech “picks & shovels” — imaging/diagnostics AI, cardiology decision support, remote monitoring, and workflow automation with clear clinician ROI and RWE-driven reimbursement paths. FDA’s AI guidance plus CMS pilots (e.g., TCET) reduce pathway uncertainty for select breakthrough devices. U.S. Food and Drug Administration IQVIA
- Consolidate fragmented device/service niches with sticky integrations — e.g., outpatient diagnostics, surgical tools with installed base, and post-acute monitoring; leverage shared service centers (regulatory/quality, rev-cycle, security) to lift margins toward peer medians noted by EY. EY
- Build a security-first platform — cybersecurity spending intentions are rising among providers, and FDA expects cybersecurity in premarket submissions; platform-level security/IP risk management can become a commercial differentiator. gkc.himss.org U.S. Food and Drug Administration
- Europe: patient access with MDR runway — EU’s MDR transition extension and removal of sell-off deadlines support revenue continuity for acquired SKUs while new HTA processes phase in; use the window to remediate files and prioritize high-margin SKUs. Public Health IQVIA
- Marketing ops as a value-creation lever — sector ad budgets are large and shifting; a HOLD.co in-house growth engine (data-driven HCP & patient targeting, content ops, compliant performance media) can compress CAC and accelerate cross-sell across assets. EMARKETER
Summary of risks & opportunities
Opportunities
- AI/RWE monetization: Clearer FDA expectations (AI lifecycle, documentation) and maturing payer openness to RWE enable differentiated software + service bundles and evidence-based pricing. U.S. Food and Drug Administration IQVIA
- Deal pipeline: Despite uneven H1-2025 medtech deal value, pent-up assets and carve-outs remain; disciplined underwriting can capture multiple expansion as growth/quality signals strengthen. Bain
Risks
- Policy & reimbursement: Changes to US advertising norms (debate over DTC restrictions) and evolving reimbursement for AI/novel tech could alter GTM and pricing; mitigate via diversified channel mix and HCP-led demand strategies. Financial Times
- Cyber & supply chain: Elevated ransomware and device cybersecurity obligations; climate/geo-trade shocks (tariffs, weather) challenge cost and continuity—necessitating zero-trust designs, SBOMs, redundant suppliers, and near-shoring where ROI justifies. gkc.himss.org IQVIA
- M&A execution: Valuation dispersion and regulatory review can stretch timelines; structure earn-outs and integration sprints around regulatory, quality, and data-security milestones aligned with FDA/EU expectations. Bain Public Health
Expert commentary (analyst POV)
- Why the timing works: Health-spend compounding and aging demographics create a rising-tide market while FDA/EU signals reduce binary risk for software-enabled devices. That combination favors scaled platforms with compliance muscle and shared go-to-market. Centers for Medicare & Medicaid Services U.S. Food and Drug Administration Public Health
- Where alpha comes from: Not from betting on one blockbuster, but from platform synergies—cross-selling to the same provider IDNs, pooling regulatory/quality ops, unifying data architectures for RWE, and running centralized performance marketing across brands where compliant. EY’s cost-structure data and Rock Health’s funding mix both point to operating discipline and evidence as the new edge. EY Rock Health
- Watchlist 2025: AI clinical decision support (imaging/cardiology), robotics with RWE-backed outcomes, and home-based diagnostics. Keep an eye on FDA’s AI guidance finalization and EU HTA implementation steps; early movers in documentation and evidence generation will cycle faster through coverage. U.S. Food and Drug Administration IQVIA
Market Landscape Overview — Health Care / MedTech
TAM, SAM & growth (CAGR)
| Scope | 2024–2025 Size | Implied Growth | Notes & Source |
|---|---|---|---|
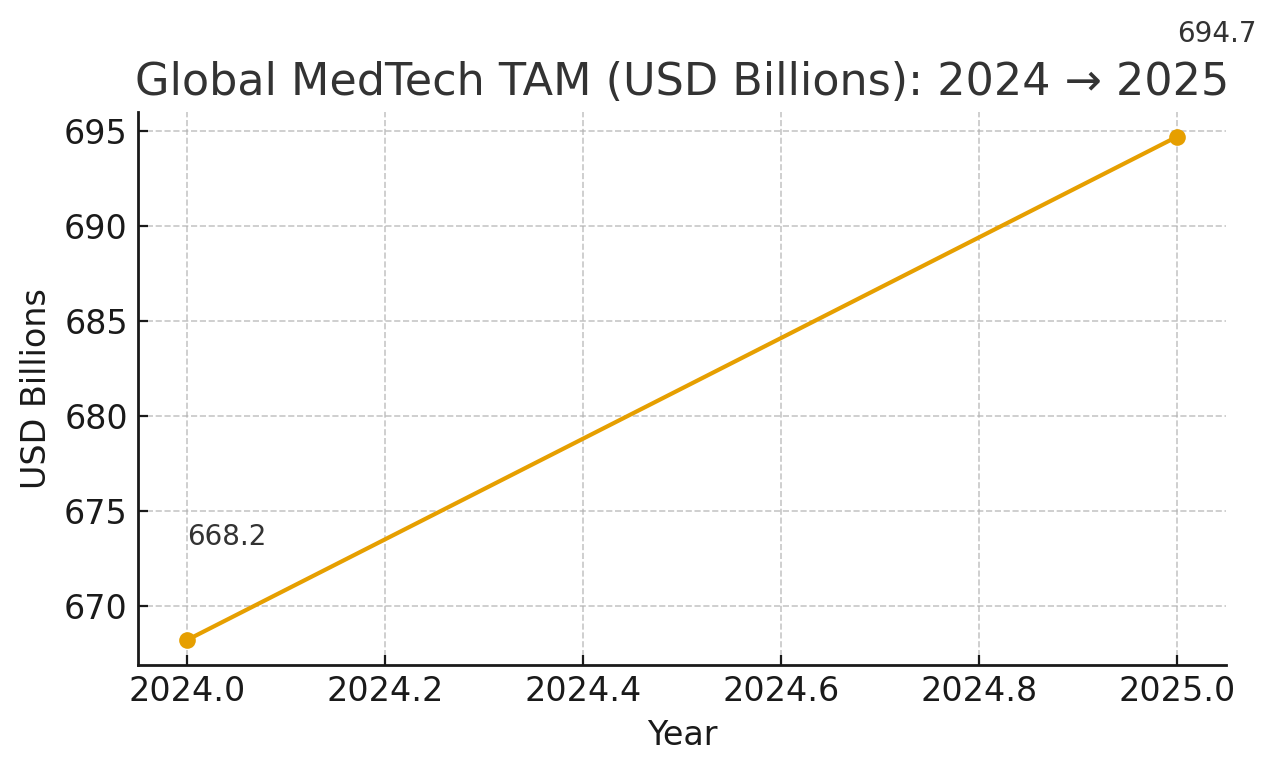
| Global MedTech TAM | 2024: $668.2B → 2025: $694.7B | ~+4% YoY | MarketsandMarkets, Jan 2025 |
| SAM (proxy: U.S. + Europe 2025) | U.S.: $199.06B (2025) + Europe: $148.30B (2025) ≈ $347.36B | U.S. CAGR 6.8% (’25–’32); Europe CAGR 4.9% (’25–’32) | FBI, Aug 2025 (U.S.) | FBI, Jul 2025 (Europe) |
| Regional mix (circa 2023–24) | U.S. ~47.2%, Europe ~26.1%, RoW ~26.7% of global market | Europe 10-yr avg growth ~5.4% | MedTech Europe Data Hub |
Competitive dynamics: consolidation vs. fragmentation
Industry structure. The top of the pyramid is concentrated (e.g., Medtronic, J&J MedTech, Abbott, Siemens Healthineers), while the long tail remains highly fragmented , especially across tools, contract manufacturing, dental, surgical disposables, and niche diagnostics. Europe alone hosts >37,000 MedTech companies and ~ 90% are SMEs ; the U.S. counts 6,500+ companies, mostly SMEs. MedTech Europe+1 AdvaMed®
Scale signals. “Medtech Big 100” rankings continue to show a stable cohort of large incumbents by revenue—useful for mapping partner/competitor landscapes and OEM–channel dynamics. Medical Design & Outsourcing
SAM here is a practical proxy for mature markets where HOLD.co is most likely to deploy capital; if you prefer a different geographic focus, we can recompute SAM accordingly. MarketsandMarkets Fortune Business Insights+1 MedTech Europe
Charts (for orientation):
Global MedTech TAM (2024→2025) — based on MarketsandMarkets.
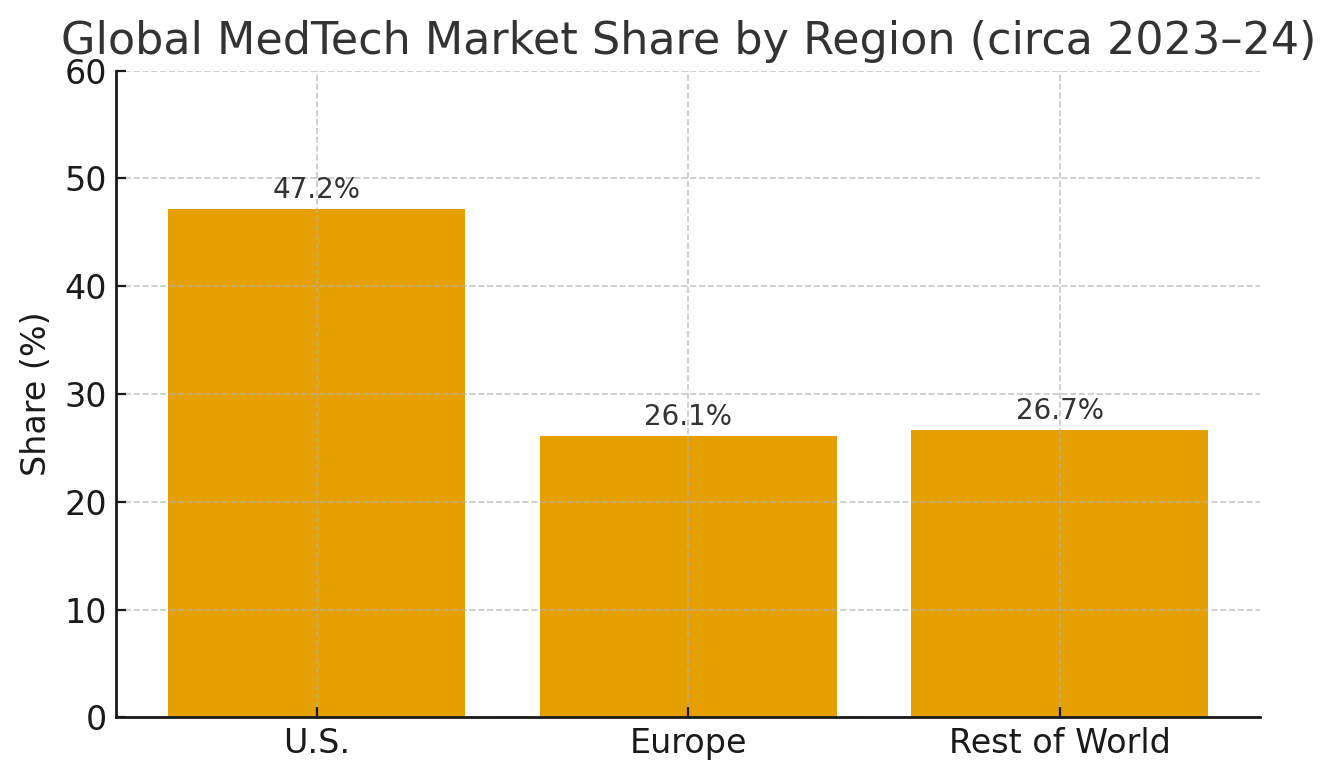
Regional share (U.S., Europe, RoW) — based on MedTech Europe. MarketsandMarkets MedTech Europe
Key segments & verticals
| Segment | Why it matters (2025 outlook) | Example leaders (linked) | Reference |
|---|---|---|---|
| In Vitro Diagnostics (IVD) | Largest global sub-sector; ongoing menu expansion (oncology, infectious diseases) and decentralization into near-patient settings. | Roche, Abbott, Danaher/Beckman Coulter, Thermo Fisher | MedTech Europe |
| Diagnostic Imaging | Stable mid-single-digit growth; AI-enabled workflow/productivity gains; capex sensitive to hospital margins & tariffs. | GE HealthCare, Siemens Healthineers, Philips | Signify Research, Jan 2025 | GVR |
| Cardiovascular / CRM / Structural Heart | High disease burden sustains demand; innovation cycles in AF ablation, valve repair/replacement, and physiology. | Medtronic, Abbott, Boston Scientific, Edwards Lifesciences | Medtech Big 100 (2024) |
| Orthopedics & Spine | Procedure volumes recovering; robotics and navigation support premium mix. | Stryker, J&J MedTech (DePuy Synthes), Zimmer Biomet, Globus | MassDevice Top 10, 2024 |
| Diabetes / Patient Monitoring & Wearables | DTC + payer pull; CGM and home monitoring benefit from hybrid/virtual care policies through Sept 30, 2025. | Dexcom, Abbott Libre, ResMed | CMS MLN901705 |
| Surgical Robotics & Tools | Installed-base moat + procedure growth; expanding into ortho, endoluminal, and soft tissue. | Intuitive, Stryker Mako, Zimmer ROSA | Medtech Big 100 (2024) |
Competitive dynamics: consolidation vs. fragmentation
Industry structure. The top of the pyramid is concentrated (e.g., Medtronic, J&J MedTech, Abbott, Siemens Healthineers), while the long tail remains highly fragmented , especially across tools, contract manufacturing, dental, surgical disposables, and niche diagnostics. Europe alone hosts >37,000 MedTech companies and ~ 90% are SMEs ; the U.S. counts 6,500+ companies, mostly SMEs. MedTech Europe+1 AdvaMed®
Scale signals. “Medtech Big 100” rankings continue to show a stable cohort of large incumbents by revenue—useful for mapping partner/competitor landscapes and OEM–channel dynamics. Medical Design & Outsourcing
| Market state | Examples | Strategic reading |
|---|---|---|
| Concentrated (few dominant OEMs) | Imaging (GE HealthCare, Siemens Healthineers, Philips), CRM/Structural Heart (Medtronic, Abbott, Boston Scientific), Surgical robotics (Intuitive) | High barriers to entry (capital, IP, service networks); software upgrades/AI modules are attach opportunities. |
| Fragmented (many SMEs/regionals) | Surgical instruments & consumables, contract manufacturing/sterilization, specialty diagnostics, dental, ophthalmic tools | Roll-up and buy-and-build potential; scale via shared commercial infrastructure and quality/regulatory systems. |
Evidence: EU company count (~37k, ~90% SMEs); U.S. company count (>6.5k); plus revenue concentration among the “Big 100.” MedTech Europe+1 AdvaMed® Medical Design & Outsourcing
Market map (visual) — major players by segment
| Segment | Representative leaders (linked) | Reference |
|---|---|---|
| Diagnostic Imaging | GE HealthCare • Siemens Healthineers • Philips | Signify Research (2025) |
| IVD (Labs & Point-of-Care) | Roche Diagnostics • Abbott • Danaher / Beckman Coulter • Thermo Fisher | MedTech Europe |
| Cardiovascular / CRM / Structural Heart | Medtronic • Abbott • Boston Scientific • Edwards Lifesciences | Medtech Big 100 (2024) |
| Orthopedics & Spine | Stryker • J&J MedTech (DePuy Synthes) • Zimmer Biomet • Globus | MassDevice (2024) |
| Patient Monitoring / Diabetes / Sleep | Dexcom • Abbott Libre • ResMed | CMS MLN901705 |
| Surgical Robotics & Advanced Tools | Intuitive • Stryker Mako • Zimmer ROSA | Medtech Big 100 (2024) |
Methodology note: This “map” focuses on well-recognized leaders that anchor each segment’s economics. It is not exhaustive; emerging challengers and niche specialists can be added as HOLD.co’s focus narrows. Signify Research Medical Design & Outsourcing MassDevice
What this means for HOLD.co (quick read)
- TAM/SAM: A ~$695B global market in 2025 with a ~$347B U.S.+EU “SAM” offers scale, while growth is steady rather than explosive. MarketsandMarkets Fortune Business Insights+1
- Segments to watch: IVD (largest), Imaging (AI workflows + trade sensitivity), Cardiovascular (innovation cadence), Ortho/Spine (robotics attach), and Home/Monitoring (policy tailwinds). MedTech Europe Signify Research Centers for Medicare & Medicaid Services
- Macro: Regulatory shifts (U.S. LDT, EU MDR/IVDR), elevated hospital labor costs, and tariff risk shape purchasing and pricing; AI adoption is a durable diffusion, not a fad. U.S. Food and Drug Administration+1 Public Health American Hospital Association The Washington Post
M&A Trends & Deal Activity — Health Care / MedTech (last 12–24 months)
At a glance. After a busy 2024 — punctuated by Boston Scientific’s buying spree and J&J’s $13.1B Shockwave deal — 2025 opened with several >$1B announcements (Stryker–Inari, Zimmer–Paragon 28, Thermo Fisher–Solventum assets) before slowing mid-year on macro uncertainty and tariff noise.
Overall health-sector deal volumes fell in 2024, but medtech strategics kept targeting category leaders and high-growth adjacencies, while PE’s share of healthcare M&A capital rebounded in early 2025. Median public med-device trading multiples remain in the ~4.2× EV/Rev and 14.1× EV/EBITDA range, while private medtech deal medians diverge by buyer type (PE vs. strategics) and size/quality of the asset. PwC Mercer Capital
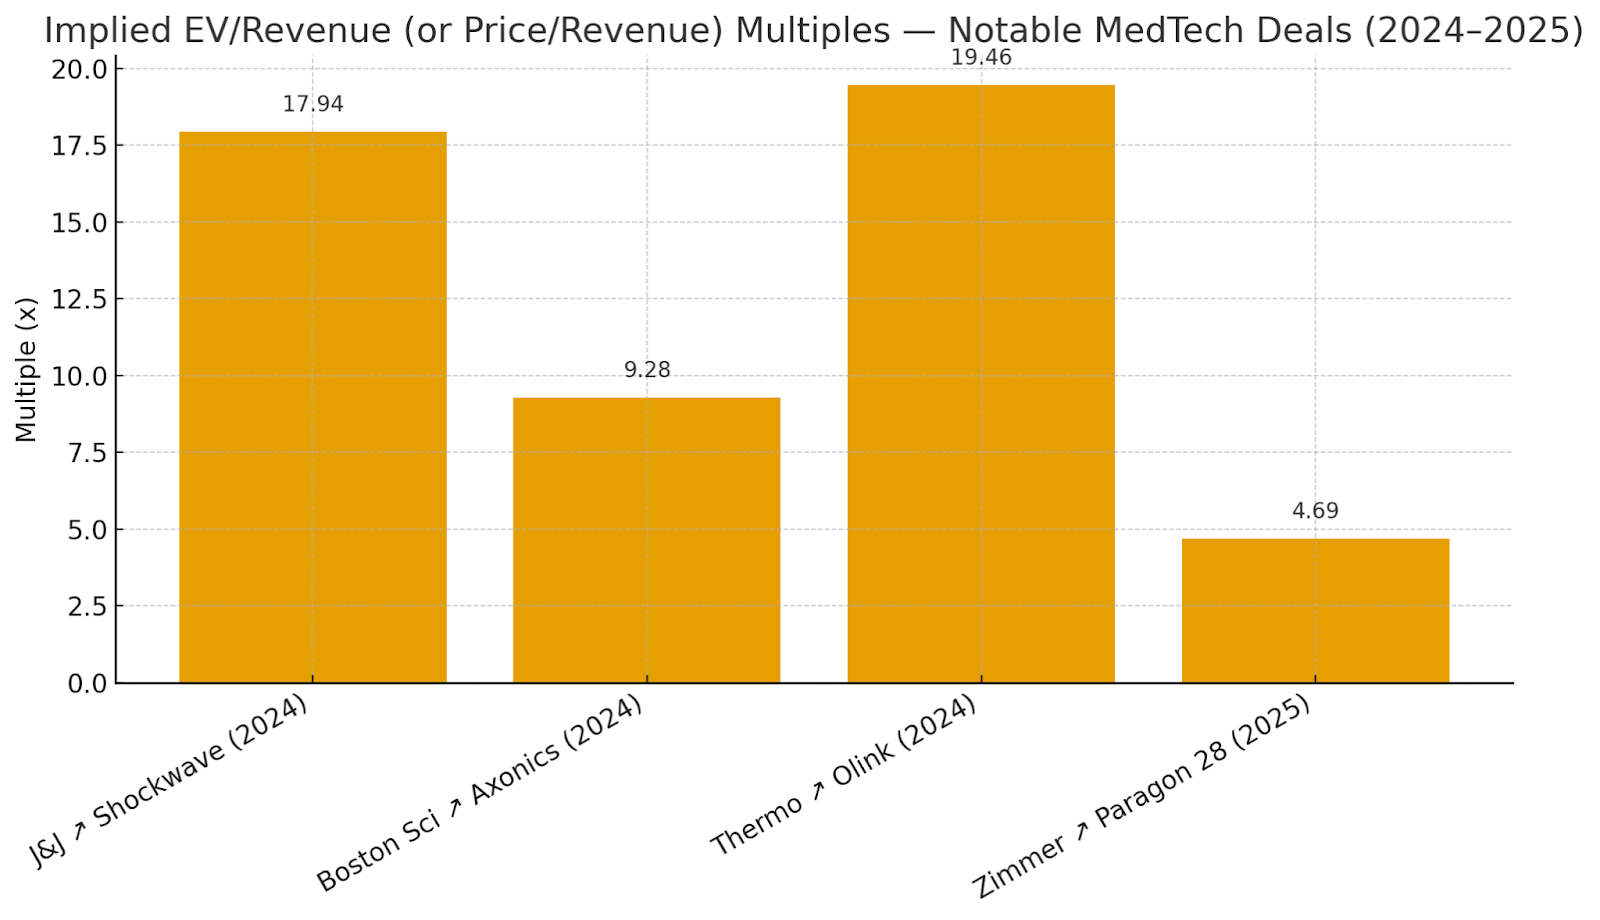
Notable acquisitions (past 12–24 months) & implied revenue multiples
- Johnson & Johnson → Shockwave Medical (closed May 31, 2024). EV ≈ $13.1B; SWAV 2023 revenue $730.2M → ~17.9× EV/Rev. Focus: intravascular lithotripsy (cardio).
- Boston Scientific → Axonics (closed Nov 15, 2024). EV ≈ $3.3B; AXNX 2023 revenue $366.4M → ~9.0× EV/Rev. Expands sacral neuromodulation.
- Boston Scientific → Silk Road Medical (announced Jun 18, 2024; closed Sept 17, 2024). EV ≈ $1.16–1.28B; 2024 revenue guidance $194–198M → ~6.0× EV/Rev. Stroke prevention (TCAR).
- Becton Dickinson (BD) → Edwards Lifesciences’ Critical Care business (announced Jul 2024). EV ≈ $4.2B; 2023 revenue $928.1M → ~4.5× EV/Rev. Adds advanced monitoring. MedTech Dive
- Stryker → Inari Medical (announced Jan 6, 2025). EV ≈ $4.9B; Inari FY2024 revenue ≈ $603M → ~8.1× EV/Rev. Peripheral thrombectomy/venous disease.
- Owens & Minor → Rotech Healthcare (announced Dec 2024). EV ≈ $1.36B; 2023 revenue ~$750M → ~1.8× EV/Rev. Home respiratory/DME distribution. MedTech Dive
What this signals: Premium multiples concentrate in cardio-structural heart, neuromodulation, and high-growth, IP-rich niches with robust gross margins and durable demand; distribution and mature categories transact at lower revenue multiples unless scale and synergy are compelling. (Synthesis of deals above and public med-device trading medians.) Mercer Capital
Recent Deal Multiples Visual
(Implied from public disclosures; see table above for sources.)
(Chart shows multiples; Olink and Paragon 28 use equity value as a proxy where EV wasn’t disclosed.)
Private equity & strategic buyer activity
Strategics kept buying: 2024 saw 38 MedTech acquisitions closed vs. 22 in 2023 (by Dec. 12), led by Boston Scientific, BD, and others; 2025 began with several >$1B announcements but slowed mid-year. MedTech Dive
PE’s participation rebounded in 2025: In Q1’25, PE accounted for ~54% of deal volume and 40% of capital in healthcare M&A; PE median EV/EBITDA rose to 18.3× (from 11.4× in 2024). Strategic medians eased to 8.0×.
Healthcare technology investment by PE rose 50%+ in 2024 to $15.6B, reflecting appetite in tech-enabled care and software/analytics. Mercer Capital
Implication for HOLD.co: PE dry powder and strategics’ category leadership theses create competitive tension for quality MedTech assets; expect processes to bifurcate—IP-heavy, high-growth assets trade at double-digit EV/Rev in cardiology/neuromodulation, while scale/distribution plays clear near mid-single-digit EV/Rev (or high-single-digit EV/EBITDA).
Valuation benchmarks (Revenue & EBITDA) and public vs. private comparables
Public med-device trading medians (Q4’24 snapshot): EV/Rev ~4.20×; EV/EBITDA ~14.1× for a peer set including SYK, ZBH, TFX, etc. (Mercer Capital, Q1’25).
Private healthcare deal medians (Q1’25):
- PE buyers: EV/EBITDA 18.3×; EV/Rev 1.5×
- Strategic buyers: EV/EBITDA 8.0×; EV/Rev 1.9× (PitchBook data via RL Hulett).
Valuation multiple table (public vs. private)
| Cohort | EV / Revenue (x) | EV / EBITDA (x) | Notes / Source |
|---|---|---|---|
| Public Medical Device – Median (Q4’24 snapshot) | 4.20× | 14.1× | Peer set incl. SYK, ZBH, TFX; Mercer Capital Q1 2025 (source) |
| Private Healthcare M&A – PE buyers (Q1’25) | 1.5× | 18.3× | PitchBook data via RL Hulett Q1 2025 (source) |
| Private Healthcare M&A – Strategic buyers (Q1’25) | 1.9× | 8.0× | PitchBook data via RL Hulett Q1 2025 (source) |
| Public Life Science Tools/Diagnostics – Large-cap (NTM) | — | 17.3× | KPMG LST&D Outlook Q1 2025 (source) |
| Directional private SMB benchmarks by size (cross-industry) | — | Size-linked: low- to low-double-digit | FirstPageSage 2025 meta-analysis (source) |
Key sources also cited inline above. Stern School of Business
Recent deal comps (12–24 months)
| Deal | Buyer | Announced / Closed | Enterprise Value | Target LTM Revenue | Implied EV/Rev | Source |
|---|---|---|---|---|---|---|
| Shockwave Medical | Johnson & Johnson | Announced Apr 5, 2024; Closed May 31, 2024 | $13.1B | $730.2M (FY2023) | ~17.9× | Reuters; J&J |
| Axonics | Boston Scientific | Announced Jan 8, 2024; Closed Nov 15, 2024 | $3.3B | $366.4M (FY2023) | ~9.0× | MedTech Dive; Business Wire |
| Silk Road Medical | Boston Scientific | Announced Jun 18, 2024; Closed Sept 17, 2024 | $1.16–1.28B | $194–198M (FY2024 guide) | ~6.0× | Reuters; MedTech Dive |
| Edwards Lifesciences – Critical Care (carve-out) | Becton Dickinson (BD) | Announced Jul 2024 | $4.2B | $928.1M (FY2023) | ~4.5× | MedTech Dive |
| Inari Medical | Stryker | Announced Jan 6, 2025 (pending close) | $4.9B | ~$603M (FY2024) | ~8.1× | MedTech Dive; Inari IR |
| Rotech Healthcare | Owens & Minor | Announced Dec 2024 | $1.36B | ~$750M (FY2023) | ~1.8× | MedTech Dive |
Public vs. Private Comparables (Narrative)
- Public comps: exiting 2024, med-device medians were ~4.2× EV/Revenue and ~17–21× EV/EBITDA depending on quarter; dispersion reflects growth, margin profile, and capital costs.
- Private comps: size and growth drive premiums. <$250M revenue businesses clearing low- to mid-teens EBITDA multiples typically show durable mid-teens growth and regulatory/quality maturity; $750M+ revenue platforms can fetch ~22× EBITDA when growth and category leadership are evident. First Page Sage
Expert Commentary: What This Means for HOLD.co’s Acquisition/Expansion Play
- Prioritize categories with clinical differentiation and reimbursement visibility. Shockwave and Axonics illustrate how proven outcomes + expanding indications command premium sales multiples; these are defensible moats for roll-ups. Reuters Boston Scientific
- Use “barbell” targeting. Anchor with one scaled platform (public-to-private or corporate carve-out) priced around public medians, then tuck in subscale assets where private EBITDA multiples remain in the mid-teens but synergies can lift to high-teens/low-20s on a pro-forma basis. First Page Sage
- Expect regulator engagement in narrow inputs. Coatings and specialized components (e.g., Surmodics) are seeing heightened FTC attention; pre-clear antitrust risk, especially for horizontal combos.
- Don’t overgeneralize tools/diagnostics. LSD deal value compressed in 1H-2024 except for top-tier assets (Olink ~20× revenue). Pursue niche, recurring-revenue tools with high switching costs and software/consumable attachment. KPMG
- PE-readiness signals. Sponsors are back at scale ($115B 2024), but want line-of-sight to operational value creation (pricing, mix, SG&A leverage). If SELL-side optionality is desired, prepare a granular synergy model (manufacturing yield, field productivity, channel mix) to support a premium. Bain
Sources (key)
- Bain & Company — Global Healthcare Private Equity & M&A Report 2025 (PE deal value $115B; regional mix). Bain
- PwC — US Health Industries Deals 2025 Midyear Outlook (context on 2025 activity by sub-sector). JNJ.com
- Mercer Capital — Value Focus: MedTech & Device Industry, 1Q-2025 (public med-device valuation medians; trend charts).
- KPMG Corporate Finance — Life Sciences Tools & Diagnostics Newsletter (Q3-2024) (Olink ~20× revenue; YTD deal totals). KPMG
- Deal press & filings: J&J–Shockwave (value & close) Reuters JNJ.com; Boston Scientific–Axonics (EV; Axonics FY2023 revenue) Boston Scientific Business Wire; Thermo–Olink (close; FY2023 revenue) Thermo Fisher IR SEC Filing; Zimmer–Paragon 28 (terms; revenue guide) Paragon 28; GEHC–MIM Software (price).
- First Page Sage — Private Company Valuation Multiples (size-based medtech EBITDA benchmarks). First Page Sage
Technology & Innovation Trends — Health Care / MedTech
State of Digitization & Software Adoption
- AI/ML is now mainstream in MedTech. The FDA-cleared/approved list of AI/ML-enabled devices surpassed 1,000 by mid-2025; 223 were cleared in 2023, underscoring accelerating software adoption in regulated devices. Siemens Healthineers
- Cloud imaging is moving from pilots to standard. Nearly two-thirds of U.S. imaging organizations already use the cloud for diagnostic image viewing/storage or expect to within three years (KLAS Imaging in the Cloud 2024). IDC’s 2024–2025 vendor assessment also flags enterprise imaging platforms as a critical spend focus through 2025. KLAS Research Philips Documents
- Regulatory infrastructure is catching up to iterative software. FDA finalized Predetermined Change Control Plan (PCCP) guidance in Dec 2024, enabling safer post-market model updates for AI-enabled devices (and issued further AI guidance updates in 2025). This reduces friction for continuous improvement and favors companies with strong MLOps/QMS. Federal Register McDermott+ FDA
Implication for HOLD.co: Digital features (AI decision support, connectivity, analytics) are no longer differentiators—they’re table stakes in growth segments (imaging, monitoring, navigation). Targets with demonstrable software roadmaps and cloud-ready architectures will compound value faster.
Emerging Tech Reshaping MedTech
- Artificial Intelligence (traditional & generative). AI is embedded across imaging, navigation, and monitoring. FDA’s PCCP path plus >1,000 AI/ML device clearances signal durable momentum; however, adaptive/generative approvals are still rare (as of Q3-2024, only three adaptive-logic devices cleared; no generative-AI medtech products). Expect more lifecycle-managed approvals as validation methods mature. Siemens Healthineers Boston Consulting Group Federal Register
- IoT/IoMT & Connected Care. Hospitals typically run 10–15 medical devices per bed, with known-exploited vulnerabilities present in 63% of hospital networks—connectivity is essential but expands risk, raising the bar for secure design and update mechanisms. HIPAA Journal
- Blockchain (targeted use cases, early stage). 2024–2025 research shows promising proofs for supply-chain traceability and clinical-trial auditability, but limited real-world clinical deployment; consider it selectively where multi-party provenance is critical (implants, high-value consumables, complex trials). PMC ScienceDirect
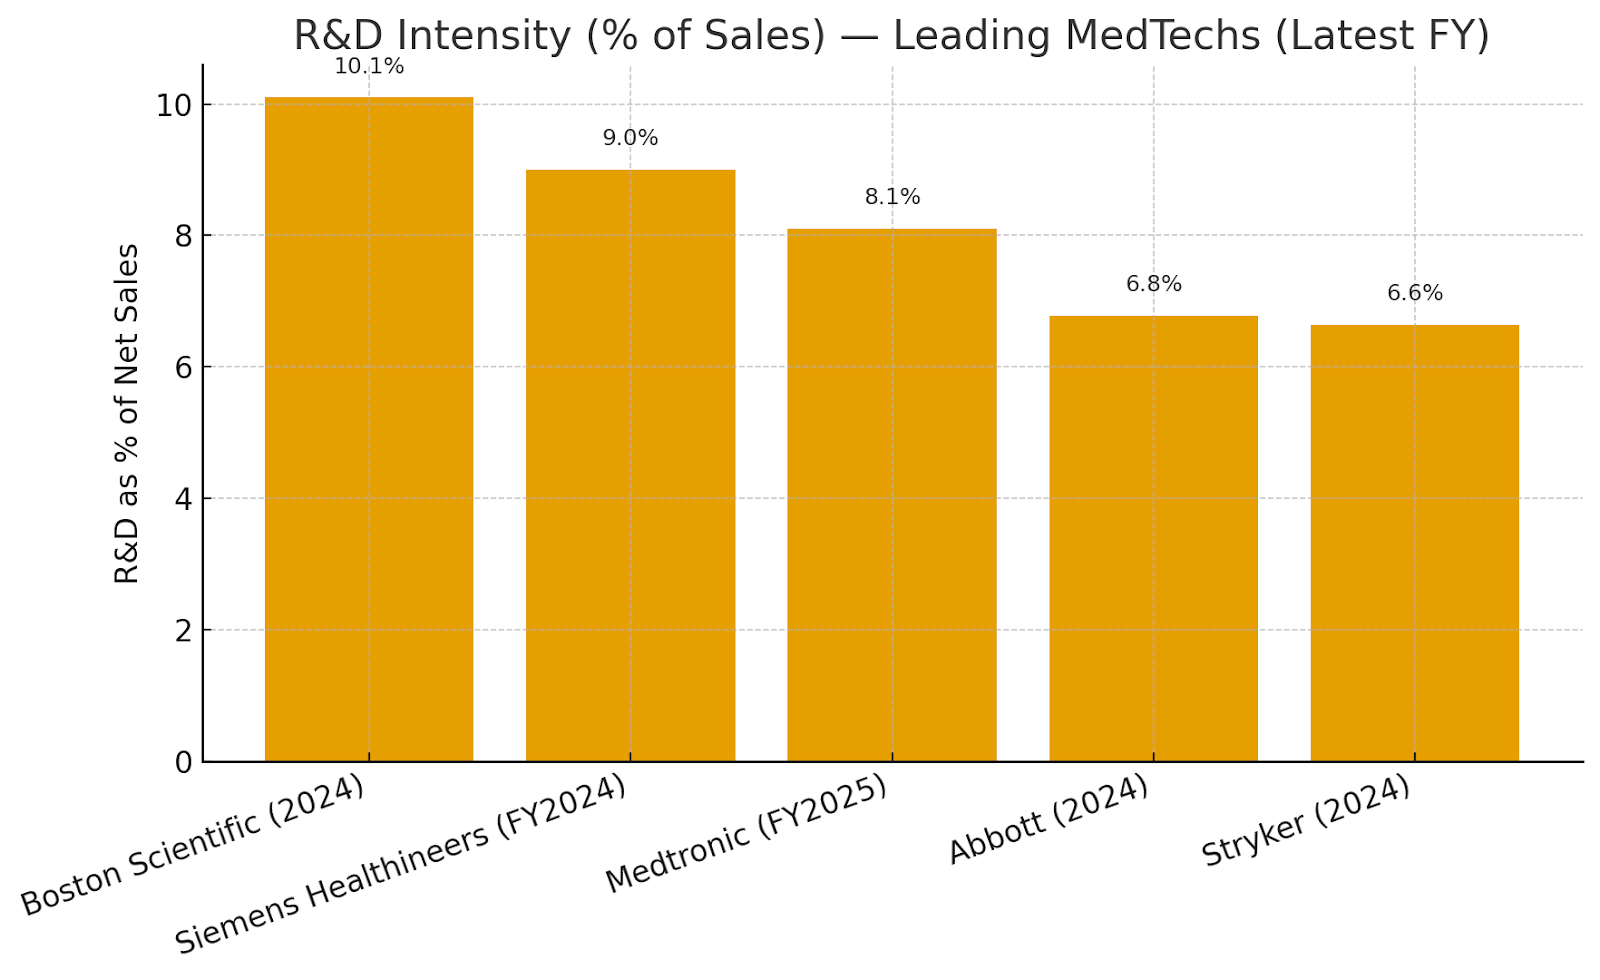
R&D spend benchmarks (latest fiscal year)
| Company | Fiscal Year | R&D Spend (reported) | Net Sales/Revenue (reported) | R&D as % of Sales | Source |
|---|---|---|---|---|---|
| Medtronic | FY2025 | $2.7B | $33.54B | ~8.1% | Medtronic 2025 Form 10-K |
| Boston Scientific | 2024 | — | — | 10.1% | FOH 2024 Financial Metrics |
| Stryker | 2024 | ~$1.5B | $22.6B | ~6.6% | Stryker “About” (R&D) · 2024 Comprehensive Report (Sales) |
| Abbott | 2024 | $2.844B | $41.95B | ~6.8% | Abbott 2024 Sustainability Report |
| Siemens Healthineers | FY2024 | €1,918M | — | 9.0% | Annual Report 2024 |
: Boston Scientific reports R&D as a percentage of sales (10.1%). Medtronic/Abbott amounts and sales figures are taken from their FY filings/sustainability disclosures; Stryker R&D from corporate fact page and sales from its 2024 report; Siemens Healthineers publishes “R&D intensity” at 9%. StockLight Abbott
Visual — R&D intensity comparison
The chart compares R&D as % of sales across the five companies (latest FY).
Cybersecurity & Infrastructure Risks (What’s Materially Different Now)
- Regulatory expectation is explicit. FDA’s final Premarket Cybersecurity guidance (Sept 2023) and §524B “cyber devices” requirements (SBOM, vulnerability management) are now baseline. The temporary “Refuse-to-Accept” policy expired Oct 1, 2023; submissions must meet the new bar. Ropes & Gray U.S. Food and Drug Administration
- Threat surface is growing faster than patching. Reports find KEVs are present in a majority of U.S. hospital networks and that device density (10–15 per bed) compounds exposure—especially in imaging and infusion devices. The HIPAA Journal
- Device risks are measurable. Forescout/Vedere Labs and Claroty highlight newly discovered vulnerabilities across IoMT classes and show healthcare among the top verticals for incident response. This pushes MedTechs toward SBOM transparency, coordinated disclosure, and over-the-air update capabilities. Industrial Cyber Forescout Palo Alto Networks
Operational takeaway: Any asset without remote patching, cryptographically signed updates, and inventory accuracy is becoming commercially uncompetitive (and regulatorily risky) in the U.S./EU bids.
Build vs. Buy Opportunities for Tech Innovation
- Buy to accelerate software moats. Examples: GE HealthCare × MIM Software (Apr 2024) to deepen imaging analytics; Stryker × care.ai (Sept 2024) to add ambient intelligence and smart-room capabilities. These transactions show strategics preferring acquisitions to compress timelines where clinical data sets, workflows, and hospital integrations create high entry barriers. GE HealthCare MassDevice Stryker
- Build where you control data feedback loops. FDA’s PCCP regime favors OEMs that can continually update algorithms tied to installed hardware (e.g., imaging, navigation, EP). If you have protected telemetry and longitudinal outcomes data, in-house development compounds advantage and reduces per-update regulatory drag. Federal Register
- Partner for platform economics. Cloud enterprise-imaging adoption and AI marketplaces (e.g., vendor platforms) mean integrations (not ownership) can be optimal for non-core features. KLAS and IDC indicate buyers reward vendors that orchestrate ecosystems—not just ship a single stack. KLAS Research Philips Documents
Strategy Signals & Recommendations (Data-Anchored)
- Prioritize assets with cloud-ready imaging/monitoring portfolios. KLAS shows two-thirds of providers are already moving workloads to cloud within three years—targets with vendor-neutral archives (VNAs), zero-footprint viewers, and multi-tenant SaaS will outperform. KLAS Research
- Underwrite AI lifecycle capability, not one-off models. Use PCCP readiness, real-world monitoring, and model update cadence as diligence gates; weight these higher than raw “AI number of claims” in marketing. Federal Register
- Security posture is a revenue driver. Require SBOMs, coordinated vulnerability disclosure, and remote update pipelines in all diligenced products; discount valuations where devices are hard to patch or run unsupported OSs given hospital KEV prevalence. The HIPAA Journal
- Blend buy/build for time-to-market. Where regulated workflow and hospital integrations are the bottleneck (e.g., oncology imaging analytics, ambient intelligence), acquire proven software (GEHC–MIM; Stryker–care.ai). Where your installed base yields proprietary data advantages, build and lean on PCCP to iterate. GE HealthCare Stryker Federal Register
- Treat blockchain as selective. Consider pilots for implant provenance or trial audit trails when multi-party trust and traceability are core; otherwise, favor mature cloud and zero-trust architectures over nascent blockchain stacks. PMC ScienceDirect
Sources (Key References Cited Above)
- BCG, AI and Machine Learning Stake a Claim on MedTech, May 7, 2025. Siemens Healthineers Boston Consulting Group
- KLAS, Imaging in the Cloud 2024. KLAS Research
- IDC MarketScape excerpt, U.S. Enterprise Medical Imaging 2024–2025. Philips Documents
- FDA, Cybersecurity in Medical Devices Final Guidance (Sept 2023); Section 524B requirements. Ropes & Gray U.S. Food and Drug Administration
- FDA, PCCP for AI-Enabled Devices Final Guidance (Dec 2024) & 2025 updates. Federal Register U.S. Food and Drug Administration
- Corporate filings & reports: Medtronic FY2025 10-K; Stryker 2024 comprehensive report & corporate R&D page; Abbott 2024 Sustainability; Siemens Healthineers Annual Report 2024. StockLight Abbott
- Forescout/Vedere Labs & Claroty device-risk research; HIPAA Journal KEV prevalence. Forescout Industrial Cyber The HIPAA Journal
- Peer-reviewed/academic on blockchain in healthcare (2024–2025). PMC ScienceDirect
Operations & Supply Chain Landscape — Health Care / MedTech (2025)
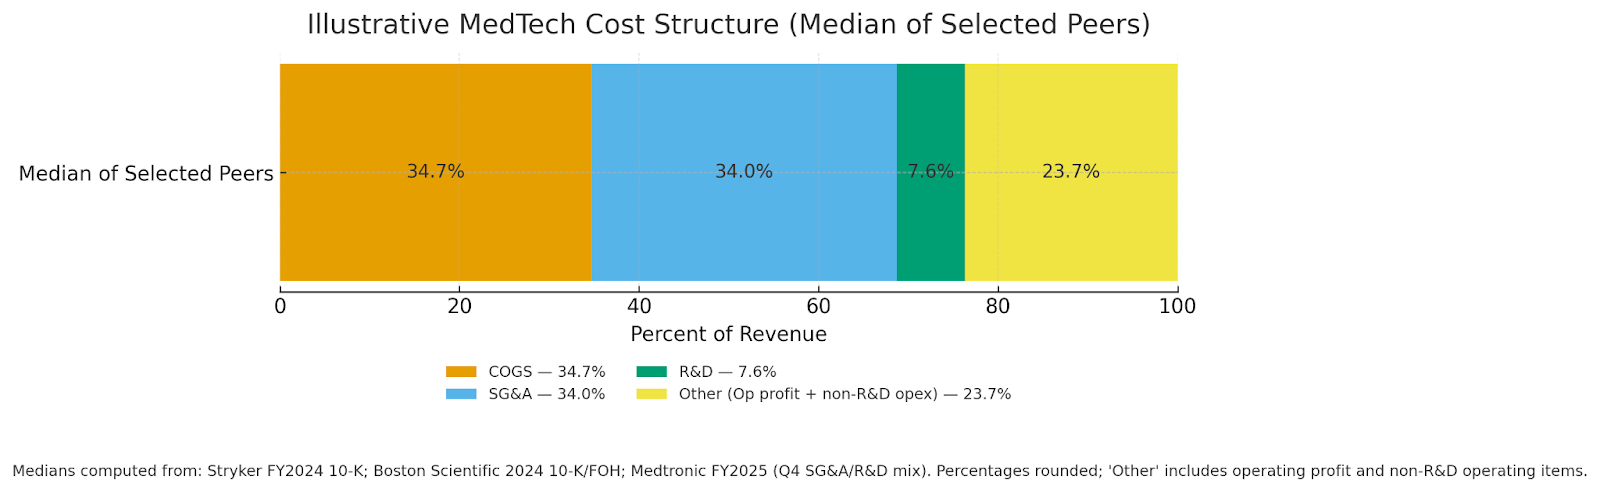
Key takeaways. MedTech cost structures remain materials- and SG&A-heavy (median COGS ~35% of sales; SG&A ~34%; R&D ~8%), with sterilization rules, semiconductor policy risk, and EU MDR timelines continuing to pressure lead times and working capital. Freight rates have retreated from mid-year peaks, offering near-term relief, but tariff uncertainty keeps logistics volatile. Labor markets are tight but stabilizing; manufacturers are leaning further into automation and contract manufacturing to add capacity and flexibility. SEC+2 investors.bostonscientific.com The Wall Street Journal
Typical cost structure (COGS, SG&A, labor/logistics)
The stacked view below reflects the median of recent disclosures from Stryker (FY2024), Boston Scientific (FY2024), and Medtronic (FY2025/Q4 mix for SG&A & R&D), showing how revenue is consumed by COGS, SG&A, and R&D; residual “Other” includes operating profit and non-R&D operating items (e.g., amortization, restructuring).
(Chart: illustrative median; sources in the benchmark table that follows.) SEC+1 investors.bostonscientific.com Investor Room
Illustrative MedTech Cost Structure (Median of Selected Peers)
Large-cap MedTech operating benchmarks (FY2024 unless noted)
| Company | Fiscal period | Gross margin | COGS % (100–GM) | SG&A % of sales | R&D % of sales | Operating margin | Sources |
|---|---|---|---|---|---|---|---|
| Stryker (SYK) | FY2024 | 63.9% | 36.1% | 34.0% | 6.5% | 16.3% (GAAP) | 10-K |
| Boston Scientific (BSX) | FY2024 | 68.6% | 31.4% | 35.3% | 10.1% | 15.7% (GAAP, TTM) | 2024 AR/10-K, FOH Q4'24, WSJ (margins) |
| Medtronic (MDT) | FY2025 (Apr’25); Q4 for SG&A/R&D | ~65.3% | ~34.7% | 30.2% (Q4) | 7.6% (Q4) | 17.8% (GAAP) | Q4 FY25 earnings deck, Macrotrends (GM), SEC exhibit (op margin) |
Notes: Logistics and sterilization costs (e.g., EtO) sit within COGS for most device makers; SG&A includes regulatory, quality, and field/service overhead. SEC+1 investors.bostonscientific.com Investor Room
Supply chain vulnerabilities & strengths
- Sterilization capacity & regulation (EtO). Roughly 20 billion devices each year are sterilized with ethylene oxide (about half of all sterile devices). In April 2024, the US EPA finalized rules tightening EtO emissions at commercial sterilization facilities—manufacturers report higher conversion and compliance costs and are diversifying sterilization modalities and vendors to avoid bottlenecks. U.S. Food and Drug Administration US EPA
- Semiconductors. MedTech uses a small share of global chips (≈1%), but supply interruptions or tariffs from the US Section 232 semiconductor probe could raise input costs and extend lead times; companies are qualifying alternate components and adding buffers as AI demand risks a new shortage cycle. MedTech Europe Manufacturing Dive Bain
- EU MDR/IVDR certification throughput. Despite extensions and 2024 amendments (Reg. 2024/1860), notified body capacity and process complexity still create approval backlogs, especially for SMEs—affecting EU supply availability and inventory planning. European Parliament RAPS Public Health
- Logistics. Ocean freight rates whipsawed in 2025 (Red Sea diversions, tariff timing), but have fallen back toward late-2023 levels since August—helpful for gross margin, though volatility remains elevated. Freightos The Wall Street Journal
- Resilience moves. Firms continue dual-sourcing and regionalization; 73% report progress on dual sourcing and 60% on regionalization in recent surveys. McKinsey & Company
Labor force trends (shortages, automation, outsourcing)
- Manufacturing workforce. US medical equipment & supplies manufacturing employment hovers around ~327–329k jobs (NAICS 3391), with wage premia vs. broader manufacturing. Industry groups estimate ~519k direct US MedTech jobs and ~3 million total (direct/indirect). Bureau of Labor Statistics AdvaMed®+1
- Automation & analytics. Device makers plan to expand factory analytics and automated reporting in 2025 to offset labor turnover and improve yield/traceability. MDDI Online
- Field service talent (provider side). BMET/HTM roles (service/repair) face shortages; demand is projected to grow ~18% (2023–2033), tightening after-sales support capacity unless companies invest in training and remote diagnostics. Business Insider
- Contract manufacturing. To add flexibility and manage costs, OEMs continue to outsource: the medical device contract manufacturing market is estimated around $77–86 B in 2024, growing high-single to low-double digits. Grand View Research MarketsandMarkets
Benchmark data: margins, throughput & cycle times
Regulatory cycle-time benchmarks (US)
| Metric | Benchmark | Source |
|---|---|---|
| 510(k) — MDUFA V goal (Avg Total Time to Decision) | FY2024: 124 days; FY2025: 112 days | FDA MDUFA V goals |
| 510(k) — Observed average total days (CDRH) | ~177 days (Q1 FY2024 cohort snapshot) | FDA Performance Report (Q1 FY2024) |
| PMA — Average decision time | FY2023: 312 days; FY2024 YTD (as of Mar’25): 240 days | MedTechDive, MyStrategist |
These throughput metrics materially affect time-to-revenue and inventory buffers across the value chain (parts procurement through sterilization and final release). U.S. Food and Drug Administration+1 MedTech Dive mystrategist.com
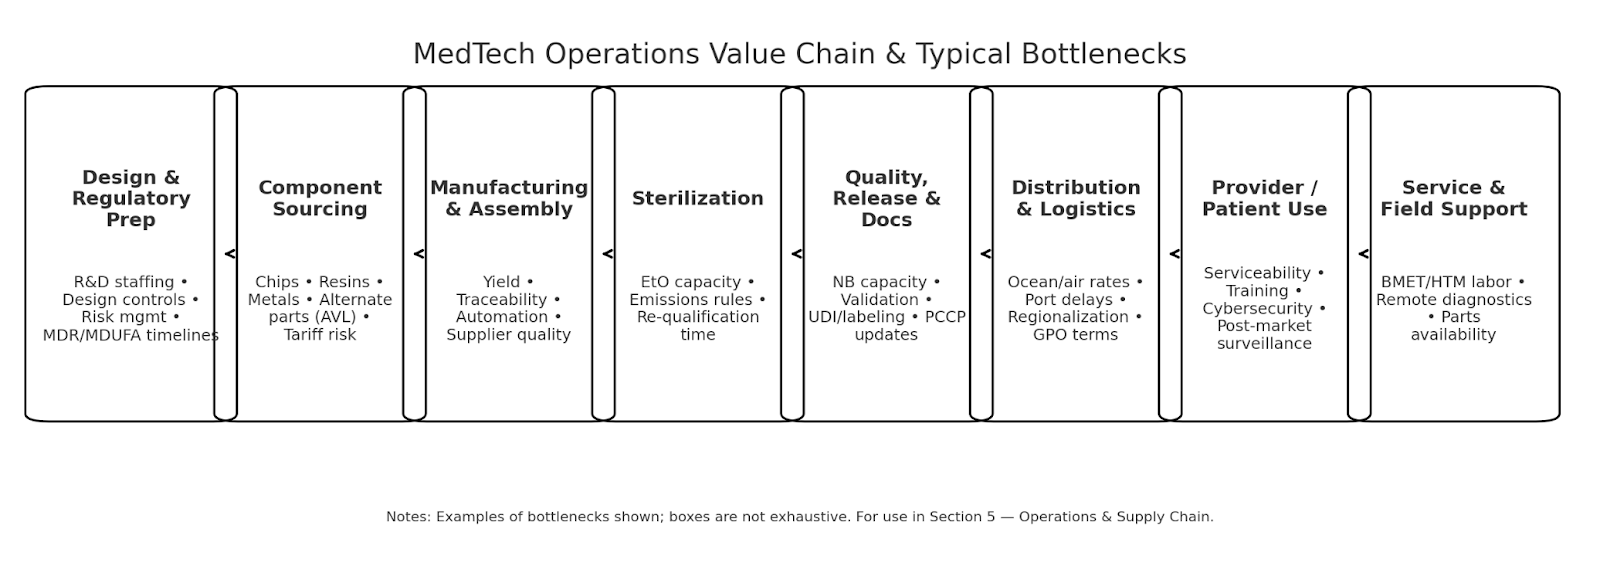
MedTech Operations Value Chain & Typical Bottlenecks
Implications for HOLD.co operating strategy (data-driven)
- Cost discipline & SKU economics. Use GM/COGS benchmarks (~65%/35%) as guardrails; prioritize SKUs where sterilization & chip content risks are lowest or can be dual-sourced without redesign. SEC
- Sterilization resilience. Secure multi-modal sterilization capacity (EtO + e-beam/X-ray where feasible), and pre-qualify alternates; model EPA compliance costs in COGS and pricing. US EPA
- Semiconductor risk management. Build AVL depth for mature-node components, monitor Section 232 outcomes, and align with EMS/CM partners on form-fit-function alternates and buffer stocks. Manufacturing Dive, MedTech Europe
- EU MDR portfolio planning. Phase EU launches and recertifications to match NB capacity; deploy incremental QA/RA resources against Article 10a supply-interruption obligations. Public Health, RAPS
- Logistics playbook. Lock in mid-term ocean contracts while spot rates are easing; maintain flex lanes for air on critical SKUs. Track FBX/Xeneta for rate triggers tied to tariff calendars. The Wall Street Journal, Freightos
- People & automation. Continue analytics/automation roll-out on the shop floor; expand BMET/HTM talent pipelines and remote-service tools to protect uptime post-sale. Consider contract manufacturing to flex capacity. MDDI Online, Business Insider, Grand View Research
Sources (selected)
- Stryker 2024 Form 10-K (margins/SG&A/R&D). SEC
- Boston Scientific 2024 AR/10-K; FOH Q4 2024 (GM; SG&A/R&D %); WSJ margin snapshot. Boston Scientific, The Wall Street Journal
- Medtronic FY25 earnings deck & SEC exhibit (GM/SG&A/R&D %; op margin). Investor Room, SEC, Macrotrends
- FDA MDUFA V goals & performance (cycle times). U.S. Food and Drug Administration
- EtO sterilization prevalence & 2024 EPA rule. FDA, US EPA
- Chip supply risk & tariffs. Manufacturing Dive, MedTech Europe, Bain
- EU MDR capacity and 2024 amendments. RAPS, European Parliament, Public Health
- Freight markets 2025 (WSJ; Freightos). The Wall Street Journal, Freightos
- Labor & outsourcing (BLS/AdvaMed; automation trend; contract manufacturing market size). Bureau of Labor Statistics, AdvaMed, MDDI Online, Grand View Research
Regulatory and Legal Environment (Health Care / MedTech)
Key compliance considerations (by regime)
- FDA (U.S.) devices. Core duties remain establishment registration/listing, premarket (510(k)/PMA/IDE), labeling, medical device reporting, and (from Feb 2, 2026) transition to the Quality Management System Regulation (QMSR) aligning Part 820 with ISO 13485. Until then, QSR applies. U.S. Food and Drug Administration+2 Federal Register
- Cybersecurity. FDA’s 2023 final premarket cybersecurity guidance and FDORA §524B (“cyber devices”) expectations (e.g., SBOM, secure update processes) now inform premarket submissions. Federal Trade Commission+1
- Radiation-emitting products. Additional reporting under EPRC (21 CFR 1000+) for x-ray/UV/laser, separate from device clearance. U.S. Food and Drug Administration
- EU. MDR/IVDR continue to tighten clinical evidence and post-market surveillance; 2023/607 extended transition deadlines and the sell-off deadlines were lifted; Notified-Body capacity remains a constraint (51 NBs designated across MDR/IVDR as of Mar 2025 per EC survey). Data Privacy Framework Public Health+1
- AI in devices. The EU AI Act (2024) phases in additional obligations on “high-risk” AI systems, including many medical devices. Digital Strategy
- UK. MHRA is rolling out a recognition pathway to leverage approvals from “comparable regulator countries” and a new devices framework—timelines staged via 2024–2025 roadmaps. GOV.UK Emergo by UL RAPS
- HIPAA / HHS (U.S. health data).
- Privacy Rule strengthened protections for reproductive health information (final rule Apr 26, 2024; implementation through 2024–2026 milestones). Federal Register HHS.gov AHIMA
- Security Rule modernization is proposed (NPRM Jan 6, 2025) with more prescriptive cybersecurity controls—material for covered entities/BAs once finalized. Federal Register HHS.gov
- HHS/OCR’s earlier web-tracking guidance was vacated by court; organizations should still scrutinize trackers given overlapping FTC/state laws. HH Health Law Blog
FTC (marketing & health apps)
- Health Breach Notification Rule was modernized in 2024 to cover many health apps/wearables outside HIPAA; enforcement remains active. The FDA Group
- Health Products Compliance Guidance requires rigorous substantiation (“competent and reliable scientific evidence”) for health-related claims. eCFR
- GDPR / UK GDPR (health & biometrics). Health data is special-category data requiring an Art. 6 lawful basis and an Art. 9 condition; cross-border transfers may rely on the EU-U.S. Data Privacy Framework where certified. GDPR ICO EUR-Lex
- U.S. state privacy (consumer health data). Washington’s My Health My Data Act (effective Mar 31, 2024; geofencing ban operative earlier) and Nevada SB 370 impose opt-in/notice duties on CHD; Colorado expanded “sensitive data” to biological/neural data. Washington Attorney General Washington State Legislature WilmerHale Hunton Andrews Kurth
Licensing, zoning, and certification hurdles
- State/device licensing (U.S.). Several states require device manufacturer/distributor or home medical device retailer licenses in addition to FDA registration—e.g., California CDPH licensing (applications/fees; HMDR). Plan timelines (often months) before distribution. CDPH+3
- CLIA (labs/IVDs). U.S. clinical laboratories must hold CLIA certification (42 CFR 493) appropriate to test complexity; separate from FDA obligations. eCFR
- MDSAP/ISO 13485. While QMSR aligns with ISO 13485, FDA does not require ISO certificates; however, MDSAP can substitute for routine FDA inspections and is accepted by the U.S., Canada, Australia, Japan, and Brazil—valuable for multi-market strategies. Covington & Burling U.S. Food and Drug Administration+1
- Environmental/zoning (sterilization). Ethylene oxide sterilizers face stringent new EPA emission controls and often local air permits—capex and siting constraints. U.S. Food and Drug Administration+1
ESG & sustainability pressures with regulatory bite
- Emissions & toxics. EPA’s final EtO sterilizer rule adds controls, monitoring, and community risk communication; PFAS (PFOA/PFOS) designated hazardous under CERCLA, elevating cleanup liability risks across supply chains (e.g., fluoropolymers). U.S. Food and Drug Administration ASCP
- Reporting & due diligence (EU). CSRD started applying to the first cohort on FY 2024 reports (published 2025), with scope and timing under active “simplification” debates; CSDDD entered into force July 25, 2024, imposing supply-chain human-rights/environmental due diligence on large firms. Finance DART Reuters European Commission
- U.S. SEC climate rule. The 2024 climate disclosure rule remains stayed and the SEC ended its defense (Mar 27, 2025); outcome pending—monitor if you’re U.S.-listed. Environmental and Energy Law Program SEC Public Company Advisory Blog
Pending & newly effective items with material impact
A) Snapshot table (with links)
| Regulation / Rule | Scope / Who’s affected | Status & Key Dates | Operational Impact | Source |
|---|---|---|---|---|
| FDA QMSR (21 CFR Part 820) | All U.S. device manufacturers | Finalized; effective Feb 2, 2026 | Align QMS to ISO 13485; update SOPs, training, supplier controls | Federal Register |
| FDA Cybersecurity (Premarket + FDORA §524B) | Connected/“cyber” devices | In effect (guidance 2023; ongoing) | SBOM, vulnerability handling, secure updates in submissions/contracts | FDA Guidance |
| EU AI Act | AI-enabled devices (often “high-risk”) | Adopted 2024; phased obligations 2025–2026 | Risk management, data/record-keeping, post-market monitoring enhancements | Official Journal (EU) |
| EU MDR/IVDR transitions | CE-marked devices & IVDs | Extensions via 2023/607; sell-off deadlines removed | Plan NB slots early; watch certificate expiries & PMS evidence | EC MDR/IVDR |
| FDA LDT rule (IVDs) | Labs offering LDTs | Finalized May 2024; staged 2025–2028 | Brings LDTs into device framework; significant QMS & submission work | FDA |
| HIPAA reproductive health privacy | Covered entities/BAs | Final rule Apr 26, 2024; compliance milestones through 2026 | New prohibitions & attestation requirement for certain PHI disclosures | Federal Register |
| HIPAA Security Rule NPRM | Covered entities/BAs | Proposed Jan 6, 2025 | Expect more prescriptive cybersecurity controls once finalized | Federal Register |
| FTC Health Breach Notification Rule | Health apps/wearables (non-HIPAA) | Final rule 2024 | Expand breach triggers/notice; elevate vendor contract hygiene | FTC Final Rule |
| WA MHMDA / NV SB370 (CHD laws) | Consumer health data handlers | Effective Mar 31, 2024 (most provisions) | Opt-in, CHD policies, geofencing limits; heightened vendor diligence | WA RCW · NV SB370 |
| EU-U.S. Data Privacy Framework | EU→U.S. data transfers | Adequacy decision July 10, 2023 | Enables transfers to certified U.S. entities; maintain DPF compliance | EU Adequacy Decision |
| EPA EtO sterilizers rule | EtO commercial sterilizers | Final Apr 2024 | New controls/monitoring; capex & siting implications | EPA |
| PFAS CERCLA designation | Manufacturers/supply chain | Final Apr 2024 (PFOA/PFOS) | Potential cleanup liability; review materials & contracts | EPA |
| CMS TCET (Medicare coverage) | FDA Breakthrough devices | Final Aug 12, 2024 | Potential faster NCDs (limited slots); plan evidence dev. early | Federal Register |
Operations checklist: where teams most often stumble
- Quality transition. Map every QSR SOP to ISO 13485/QMSR clauses; don’t over-rely on ISO certs (FDA doesn’t accept them as compliance on their own). Covington & Burling
- Notified-Body capacity. Secure NB slots 12–18 months ahead; legacy device certificates expiring under IVDD/MDD still bite throughput. Public Health
- State licensing prior to ship. Budget months for CA CDPH (and other states) licenses for manufacturing/retailers—separate from FDA registration. CDPH U.S. Food and Drug Administration
- Data & marketing. Treat consumer health data (apps, DTC sites) as sensitive; align HIPAA/FTC/state regimes; maintain robust claim substantiation. Washington Attorney General The FDA Group eCFR
Notes on sources (narrative citations above)
- FDA Device basics & registration/listing. U.S. Food and Drug Administration+1
- EU MDR/IVDR transitions & NB capacity. Data Privacy Framework Public Health+1
- HIPAA Privacy & Security updates. Federal Register+1
- State CHD laws. Washington Attorney General Washington State Legislature WilmerHale
- Environmental rules. U.S. Food and Drug Administration ASCP
- EU AI Act, EHDS/CSRD/CSDDD context. Digital Strategy Finance European Commission
- CMS TCET. Federal Register
7) Marketing & Demand Generation — Health Care / MedTech
Customer acquisition channels (what’s working now)
Patterns across MedTech:
- Digital keeps gaining share, but healthcare leans more traditional than any other industry—so event marketing, KOL/physician advocacy, and distributor co-marketing still matter alongside paid search/social. EMARKETER
- Video & social are the biggest incremental budget winners among healthcare/pharma marketers in 2025; spend intent is net positive across every digital channel. EMARKETER Mediaocean
- Offline remains critical for enterprise deals. Flagship congresses (e.g., RSNA, HIMSS) deliver high-intent buyers and peer validation (VAC committees routinely reference conference evidence & KLAS-style reviews). RSNA 2024 drew ~39,000 registrants. RSNA Premier symplr
Channel benchmarks (latest public sources)
| Channel (Healthcare/MedTech) | Benchmark metrics | Use cases | Source |
|---|---|---|---|
| Google Search Ads (Health & Medical) | CTR ~6–7% (all-industry avg); CPC $2.62 (Health & Medical); 2025 all-industry CPL $70.11 (+5% YoY) | DTC diagnostics, clinic/center finder, SMB B2B lead gen | Wordstream 2024 · Wordstream 2025 · Industry table |
| LinkedIn Ads (Healthcare) | CTR 1.25–1.75%; CPC $5–$7; CVR 3–4% (HC industry) | Enterprise/HCP targeting, ABM for IDNs/GPOs | Cometly 2024 · Huble 2025 |
| Organic search (SEO) & reviews | — (channel-level CTR/CPL vary; first-party data emphasis as paid costs rise) | Evergreen clinical content, KOL posts, KLAS/peer reviews | Insider Intelligence 2024 |
| Events / Congress (offline) | RSNA ~39k registrants in 2024; buyer committees rely on in-person demos | Imaging, robotics, capital equipment; evidence/KOL engagement | RSNA 2024 · symplr (VAC explainer) |
| Paid social / CTV / Video | Net-positive spend intent in every digital channel for HC/pharma in 2025 | Top-of-funnel education; disease awareness; demo videos | Insider Intelligence (Aug 8 2025) |
Notes: Search CPC/CPL vary widely by sub-segment and country; use numbers above as directional guardrails and base your caps/ROAS on internal 1P data. WordStream+2 Cometly Huble EMARKETER
Sales-funnel structures (DTC, B2B, enterprise, hybrid)
- DTC (consumer devices/diagnostics): Paid search/social → onsite education (transparent pricing, clinical claims) → checkout/telehealth → onboarding & review loops → subscription/refill retention. (Digital-heavy; FTC claim-substantiation rules apply.)
- B2B (clinic/ASC software, disposables): SEO + webinars + LinkedIn + SDR → demo/PAC (product approval committee) → pilot → contract; average HC sales cycles have lengthened and can run ~12–15 months for complex solutions. SmartReach
- Enterprise (IDNs/hospitals/capital equipment): ABM + KOL + congress demos → Value Analysis Committee (VAC) dossier → trials → GPO/IDN contract → roll-out & service. VACs are standard in U.S. hospitals; multidisciplinary and evidence-driven. Symplr Premier
- Hybrid models: DTC lead-gen + HCP conversion (e.g., patient-initiated demand handed to clinics); ensure compliant data sharing under HIPAA/FTC health-app rules. Sagefrog Marketing Group, LLC
CAC/LTV & brand equity benchmarks (useful ranges to underwrite)
- Healthcare CAC ranges: Recent syntheses place patient/customer CAC at ~$300–$1,000 (provider & clinic contexts; varies by service line and payer mix). Channel CACs for clinics show email/SEO generally lower than paid social/search. Promodo Focus Digital
- Enterprise healthtech CAC ratio: For $50k–$100k ACV deals, median CAC ratio ≈ 2.3; for >$100k, ≈ 1.94 (revenue/CAC). Use as a sanity check for payback under long cycles. Health Launchpad
- Macro ad cost pressure: All-industry Google Ads CPL rose ~5% YoY into 2025; healthcare CPCs remain mid-pack but volatile. WordStream
- Brand/review influence: Hospital buyers heavily weight peer input and KOLs (e.g., KLAS, congress evidence) within VACs; budget accordingly for evidence generation and voice-of-customer programs that compound over time. Premier RSNA
Competitor marketing budgets & media mix (what peers are spending)
- Budget baselines. Across industries, 2025 marketing budgets average ~7.7% of revenue (flat YoY). Healthcare sector budgets fell to ~7.2% of revenue in 2024 (from 9.6% in 2023), implying continued efficiency pressure and a tilt toward paid media over headcount. Gartner+1 Marketing Brew Campaign Asia
- Media mix direction. Healthcare/pharma are increasing digital video & social, yet still allocate a greater share to traditional channels than any other industry—useful when calibrating TV/OOH around launches and disease-awareness. EMARKETER+1
- Company disclosures (signal). Leading MedTechs (e.g., Dexcom, Insulet, Intuitive) highlight higher advertising/marketing within SG&A to support launches and geographic expansion—useful for competitive context even if companies don’t break out “marketing” separately. SEC Insulet Corporation isrg.intuitive.com
Opportunities for centralized/shared marketing ops post-acquisition (HOLD.co)
Why centralize? Budgets are tight (7–8% of revenue), sales cycles are long, and many teams under-utilize CRM/RevTech—70% fail to integrate sales plays with their tools. A shared capability stack improves ROAS, measurement, and speed to creative at portfolio scale. Gartner Campaign Asia PR Newswire
High-leverage plays backed by data:
- Shared demand engine (SEO + medical writing + webinar factory) to amortize content costs and feed ABM—aligns to peer-influence evidence in hospital buying. Premier
- Paid media center of excellence (CoE) to set channel caps (e.g., CPC/CPL guardrails from Wordstream/LinkedIn data), run creative/CTA tests across brands, and negotiate platform & event buys (HIMSS/RSNA) as a group. WordStream+1 Cometly RSNA
- Evidence & KOL program pooled across portfolio (registries, case studies, demo data at top congresses) tailored to VAC dossiers—shortens enterprise cycles. Symplr
- RevTech standardization (CRM, MAP, attribution) and sales-play libraries embedded in tools—explicitly addressing the 70% integration gap. PR Newswire
- Compliance & substantiation desk (central legal/clinical review) to accelerate campaigns while staying in-bounds on FTC health claims.
Minimal viable dashboards (KPI gates per motion)
- DTC: CAC, CAC payback, 90-day retention, refund/chargeback rate, review velocity.
- B2B: MQAs → opps conversion, meeting-to-pilot %, sales-cycle length, win rate vs. status quo.
- Enterprise: VAC stage velocity, sites activated / quarter, attach rate (disposables/SAAS), NPS by service line. Ground CAC/CPL caps in the table above and update quarterly with 1P performance.
Sources
- Insider Intelligence/eMarketer (healthcare/pharma ad spend trends; channel mix, digital video & social momentum; traditional share). EMARKETER+2
- Wordstream Google Ads benchmarks (2024–2025) incl. industry CPCs/CPL. WordStream+2
- LinkedIn Ads benchmarks (healthcare ranges, 2024–2025). Cometly Huble
- RSNA/HIMSS (event scale; offline demand creation). RSNA Premier
- VAC process (enterprise funnel reality). Symplr Premier
- CAC ranges for healthcare orgs & channel-level CACs for clinics. Promodo Focus Digital
- Gartner CMO Spend Survey (budgets as % of revenue; healthcare cut). Gartner+2
- Company signals on marketing within SG&A (Dexcom, Insulet, Intuitive). SEC Insulet Corporation isrg.intuitive.com
- Bain survey on sales-play/CRM integration gaps; commercial excellence agenda. PR Newswire Bain
Consumer & Buyer Behavior Trends — Health Care / MedTech (2025)
Changing customer needs & expectations
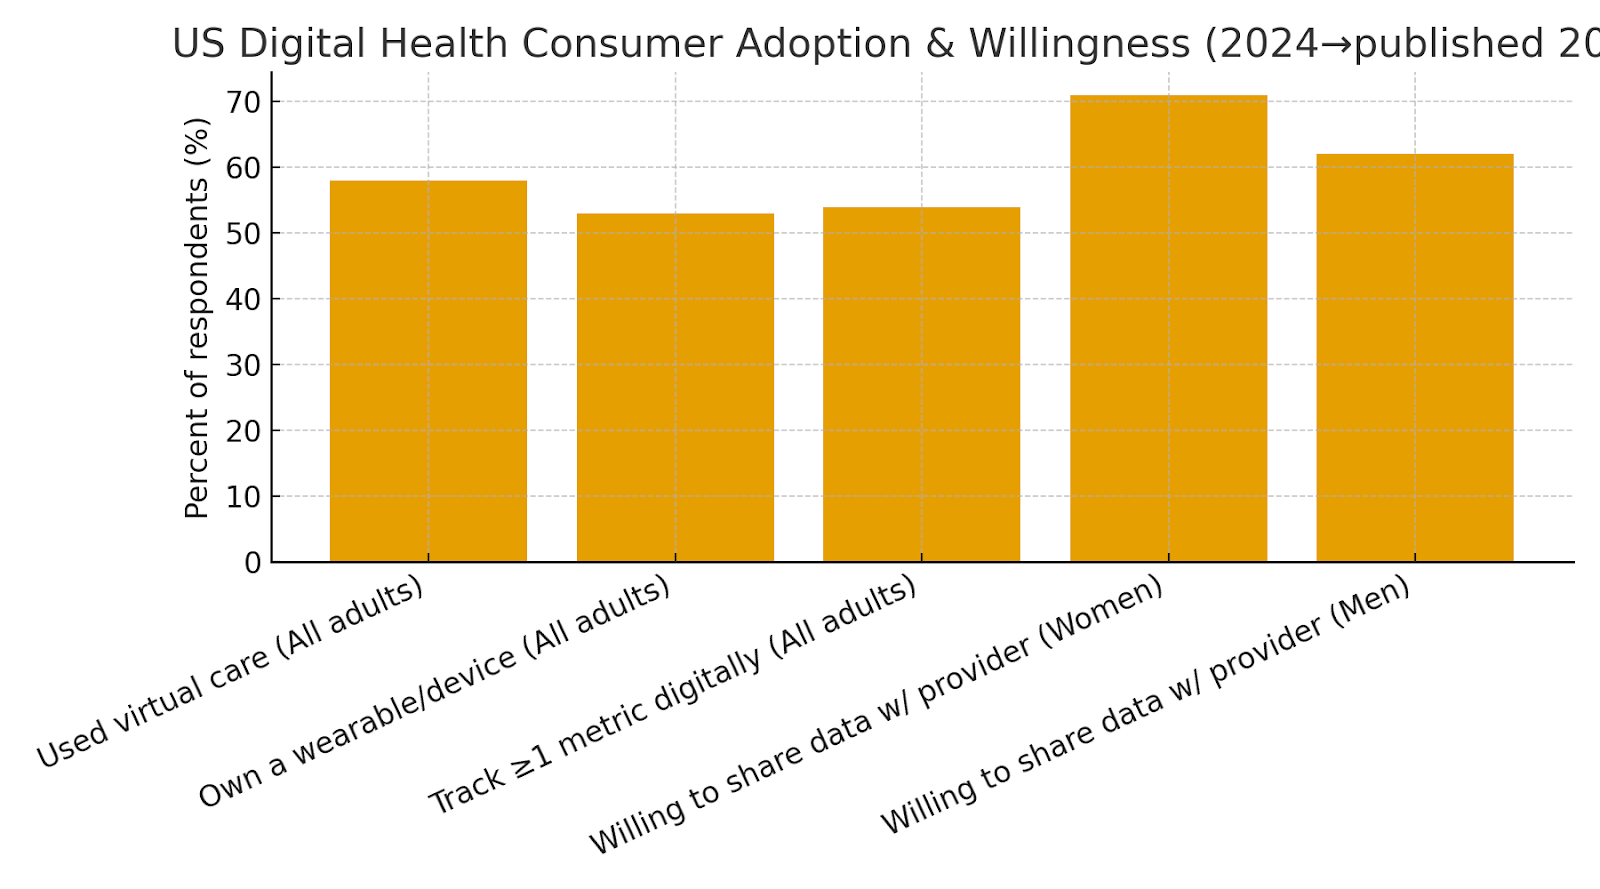
- Convenience-first, evidence-backed. Consumers increasingly expect care to be easy (virtual, asynchronous, home-based) and credible. In the latest Rock Health survey of 8,032 U.S. adults (fielded Nov–Dec 2024), 58% used virtual care in the past year, 53% own at least one wearable/connected device, and 54% track at least one health metric digitally. Rock Health
- Trust & data-sharing are contextual. Overall adoption is high, but willingness to share data depends on the counterparty and demographic segment (see §8.2). Women, for example, show high willingness to share data with providers (71%) but lower trust in information from websites/apps. Rock Health
- Outcome proof moves markets. On the enterprise side, hospital buyers are prioritizing real-world evidence (RWE), total cost of ownership, and vendor reliability; many report longer decision cycles versus prior years. NAMSA
Demographic & psychographic shifts
- Generational split: Millennials are the “digital devotees” (virtual care 68%, highest wearable ownership at 66%), while Gen Z is the least willing to share health data—17% don’t want to share with any stakeholder. Older cohorts prefer provider-led channels and show the highest trust in clinicians. Rock Health
- Women as chief health officers: Women search online more than men for diagnoses/treatments but trust less; 71% are willing to share key health information with their providers (vs 62% of men). Design choices that reduce friction and increase verification matter. Rock Health
Industry-specific usage & purchasing patterns
- Diabetes tech penetration is still early in T2D: A 2025 review estimates ~12.3% of U.S. adults with type 2 diabetes use CGM—significant headroom for growth. PMC
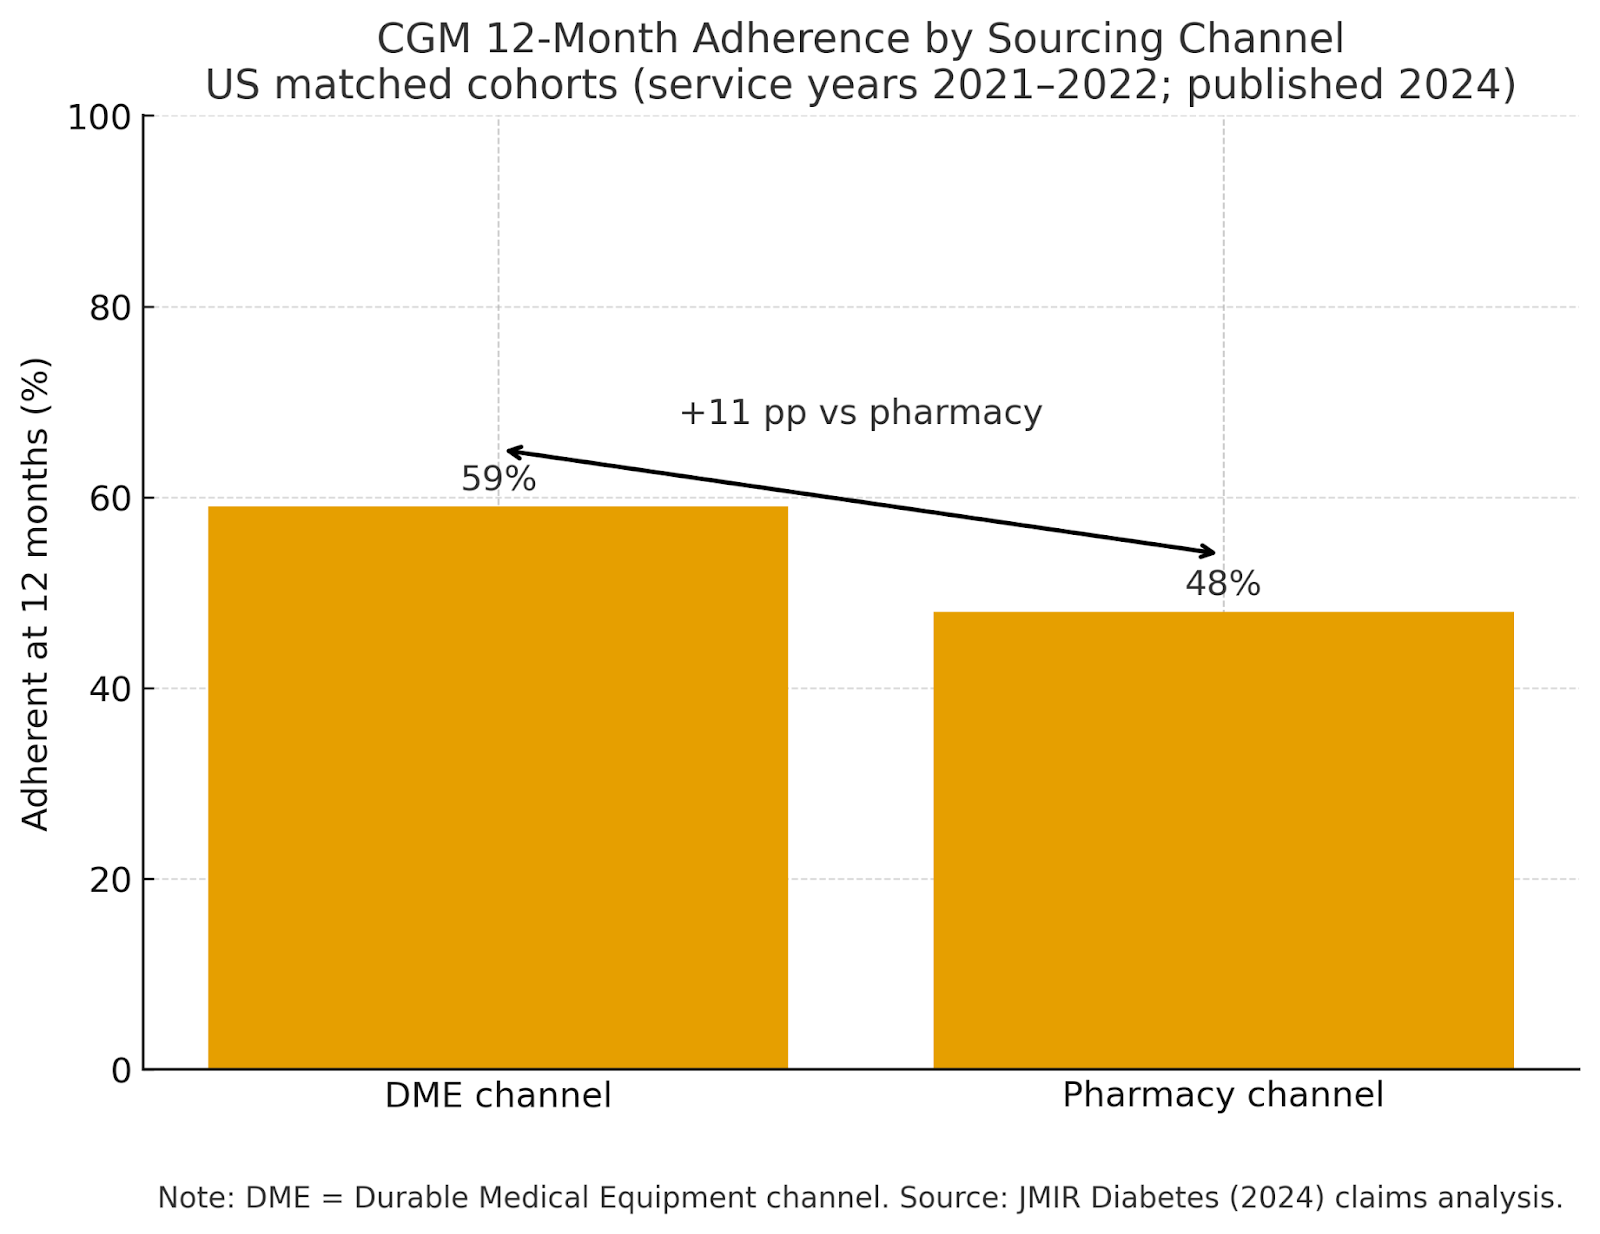
- Retention hinges on service model: Real-world claims analysis shows 12-month CGM adherence is higher when sourced via DME (59%) vs pharmacy (48%), with lower total costs among adherent DME users—underscoring the value of onboarding, training, and refill support. PMC
- Hearing care is price/support sensitive: Post-OTC, return rates can be high without strong fitting/support; one major retailer reported ~40% returns on OTC units, and only ~2% of adults with hearing difficulty opted for OTC devices, pointing to expectations for guided setup and service. The Wall Street Journal
- Provider buying patterns: In 2025, 58% of hospitals report staying with current device vendors; when switching, it’s most often for new product features and better technology, while decision timeframes are slowing as stakeholder counts and evidence requirements rise. NAMSA
- Selection criteria are evolving: Beyond price, provider organizations increasingly weight partnership quality and roadmap execution (e.g., KLAS findings across imaging/EHR), while overall EHR purchasing slowed in 2024, reflecting more selective procurement. KLAS Research Becker's Hospital Review
NPS benchmarks & customer retention metrics (illustrative, recent)
The table below consolidates recent, source-specific loyalty/satisfaction signals you can underwrite against. (Note: industry-wide “average NPS” varies by method; we emphasize verifiable studies.)
| Metric / Segment | Latest datapoint (2024–2025) | Implication for GTM / CX | Source |
|---|---|---|---|
| Virtual care usage (U.S. adults) | 58% used virtual care in past year | Sustain hybrid funnels; support async & chat-based intake | Rock Health (Mar 17, 2025) |
| Wearable/device ownership | 53% own ≥1 device; 54% track ≥1 metric digitally | First-party data programs & connected-care journeys | Rock Health (2025) |
| Women’s data sharing with providers | 71% of women vs 62% of men willing to share | Tailor permissions UX and messaging by segment | Rock Health (Apr 21, 2025) |
| Telehealth satisfaction (index) | Direct-to-consumer providers 730/1000; Payer programs 708/1000 | DTC UX still outperforms payer UX; close gaps in ease & trust | J.D. Power (Sep 26, 2024) |
| CGM penetration (Type 2 diabetes) | ~12.3% of T2D adults use CGM | Large headroom; target awareness, coverage, onboarding | PMC review (2025) |
| CGM 12-mo adherence by channel | DME 59% vs Pharmacy 48% adherent at 12 months | Retention ↑ with training/refill support; design service GTM | JMIR Diabetes (2024) |
| Remote care program loyalty (NPS) | NPS ≈ 52 (66% promoters, 14% detractors) | Well-run RPM/virtual programs can reach strong loyalty levels | JMIR Human Factors (2025) |
| OTC hearing aids adoption/returns | Retailer cited ~40% returns; ~2% OTC uptake among adults with hearing difficulty | Pair DTC with service/fitting; manage expectations, trials | WSJ (2024) |
| Hospital vendor loyalty & switching | 58% report no change in manufacturer preference; switching driven by new products & tech | Roadmaps & RWE > price alone in enterprise deals | NAMSA/Suazio (Jun 2025) |
| Enterprise decision speed | Decision processes are slowing across regions (regulatory, evidence, budget drivers) | Plan for longer cycles; build VAC-ready evidence kits | NAMSA/Suazio (Jun 2025) |
B2C vs B2B buying cycle evolution
- B2C (DTC devices/diagnostics): Growth powered by search, reviews, and creator content—but service quality (onboarding, troubleshooting, warranty/returns) is decisive for long-term retention (see hearing-aid returns). For chronic care devices, tight clinical and claim-substantiation standards apply to marketing. The Wall Street Journal
- B2B (clinics/hospitals/IDNs): Decision-making is committee-based and increasingly evidence-driven (RWE, lifecycle economics), with longer evaluations and strong weight on partnership quality/support. KLAS tracking shows vendor support and product development pace as top satisfaction drivers, and 2024 purchasing activity slowed vs 2023 in large HIT categories. KLAS Research Becker's Hospital Review
- Procurement priorities for 2025: Closer manufacturer collaboration, AI/automation that demonstrably reduces cost or improves workflow, and post-market surveillance expectations; vendor diversification for resilience. NAMSA
Quick-view charts
US Digital Health Consumer Adoption & Willingness (2024→published 2025)
shows the scale of virtual care, wearables, and provider data-sharing willingness by gender.
CGM 12-Month Adherence by Sourcing Channel (US, 2021–2022 cohorts; published 2024)
highlights retention lift from higher-touch fulfillment.
Source notes & context you can cite internally
- Generational & gender splits in adoption/trust come from Rock Health’s 10th annual Consumer Adoption survey and a 2025 women-focused cut. Rock Health+1
- Telehealth satisfaction benchmarks are from J.D. Power’s 2024 study (method: 4,070 users; 1,000-point scale). J.D. Power
- CGM market behavior includes a 2025 review (penetration estimates) and a 2024 claims analysis (adherence by channel). PMC+1
- Enterprise buyer dynamics reflect 2025 NAMSA/Suazio procurement survey (n=100 U.S./EU hospital leaders) and KLAS/Becker’s tracking of purchasing & satisfaction drivers. NAMSA KLAS Research Becker's Hospital Review
Key Risks & Threats
Industry-specific risk factors (tech disruption, policy, pricing pressure)
- Regulatory transition risk (EU MDR/IVDR, EU AI Act, FDA QMSR/LDT): MDR/IVDR capacity constraints persist (50 MDR / 14 IVDR notified bodies as of Feb 2025), while the EU AI Act layers new “high-risk AI” obligations on AI-enabled devices (fully applicable for embedded high-risk AI by Aug 2, 2027). In the U.S., FDA’s LDT final rule (May 2024) phases in device-like requirements through 2027–2028, although a March 31, 2025 district court decision vacated the rule—leaving material uncertainty pending appeal or new rulemaking. Digital Strategy Healthcare & Life Sciences Blog U.S. Food and Drug Administration Emergo by UL
- Sterilization & environmental compliance: EPA’s 2024 EtO standards tighten emissions limits for sterilization facilities—raising cost and capacity risk for ~20B+ devices sterilized annually. Portfolio exposure to single providers/sites is a key vulnerability. European Commission
- Trade, tariffs & procurement barriers: New U.S.–EU tariff actions and the EU’s 2025 move to curb Chinese medtech participation in large public tenders increase price and supply volatility for imaging, capital equipment, and consumables. Reuters
- Cybersecurity & privacy enforcement: FDA’s 2023 premarket cyber guidance and 2024–2025 HIPAA/OCR and FTC HBNR updates elevate breach liability and vendor-risk scrutiny for connected devices and cloud software. Reuters Federal Trade Commission
- Reimbursement uncertainty: CMS’s TCET pathway (finalized Aug 2024) offers a route to Medicare coverage for a small number of Breakthrough devices (up to ~5/year), but coverage is conditional and time-limited—sustained payment depends on post-market evidence. Federal Register Jones Day
- Materials restrictions (PFAS): EU-wide PFAS restrictions under REACH are advancing with potential derogations but substantial compliance/reporting burdens; U.S. EPA actions (e.g., CERCLA designation of PFOA/PFOS) expand liability exposure and reporting obligations. European Chemicals Agency US EPA
Competitive moats & erosion factors
- Installed base, service networks and data ecosystems remain durable moats (e.g., robotic surgery: ~10.5k da Vinci systems installed globally by Q2’25), but tender-driven price transparency and AI commoditization can erode pricing power in imaging, diagnostics, and commodity disposables. Intuitive National Audit Office (NAO)
Dependency / concentration risks
- Distributor & GPO concentration: Most U.S. hospitals purchase through national GPOs; large GPOs (Vizient, Premier, HealthTrust) and a few distributors control access and terms. Company disclosures illustrate how a small set of distributors can represent >60% of revenue (example: Insulet’s “Distributor A/B/C” each >20% in recent filings). Vizient Q4 Capital
Barriers to entry vs. barriers to scale
- Entry barriers: regulatory authorization (MDUFA timelines/fees), notified-body capacity, clinical evidence, quality systems. Scale barriers: procurement centralization (GPOs/NHS Supply Chain), post-market surveillance obligations, multi-jurisdiction privacy/AI compliance, and field-service footprint. FDA’s MDUFA V targets 510(k) total-time reductions through 2027, but industry days and evidence burdens still dominate the critical path. U.S. Food and Drug Administration
Litigation / regulatory exposure
- Product liability & recall overhangs can be multi-year and material (e.g., Philips Respironics CPAP litigation settlements across 2024–2025). Antitrust scrutiny has intensified—FTC recently moved to block Edwards Lifesciences/JenaValve on pipeline competition grounds—raising execution risk for tuck-ins and roll-ups. Market Watch Reuters
MedTech Risk Register (12–24 months)
| Risk Factor | What Could Happen | Likelihood (12–24m) | Impact | Leading Indicators | Mitigation Levers | Sources |
|---|---|---|---|---|---|---|
| Regulatory transitions (EU MDR/IVDR; EU AI Act; FDA LDT/QMSR) | Certification delays; dual-compliance overhead (MDR/IVDR + AI Act); U.S. LDT rule uncertainty affecting IVD roadmaps | High | High | NB capacity, AI Act milestones (2025–2027), FDA policy updates & litigation outcomes | Early NB slots; AI risk mgmt files; modular evidence plans; parallel UDI/QMS harmonization | EC NB Survey (Feb 2025); EU AI Act timeline; FDA LDT final rule |
| Sterilization capacity & EtO regulation | Capex and throughput impacts; localized shortages if sites shut or retool | Medium–High | High | EPA enforcement updates; sterilizer uptime; lead-times for critical SKUs | Dual-site validation; cycle-time mapping; alternative modalities where feasible | EPA EtO rule (2024) |
| Trade, tariffs & procurement barriers | Higher landed costs; lost access to tenders; sourcing shifts (U.S.–EU–China) | Medium | Medium–High | Tariff announcements; EU IPI actions; FX volatility | Localize final assembly; tariff engineering; diversify supplier geographies | WaPo (May 2025); Reuters (Jun 2025) |
| Cybersecurity & privacy enforcement | Costly incidents; delayed clearances; fines under HIPAA/FTC HBNR | High | High | FDA premarket cyber expectations; OCR audit notices; breach trends | SBOMs; coordinated vuln disclosure; incident drill-downs; vendor risk controls | FDA cyber guidance; FTC HBNR (2024) |
Risk Heatmap
A quick visual to support portfolio discussions:
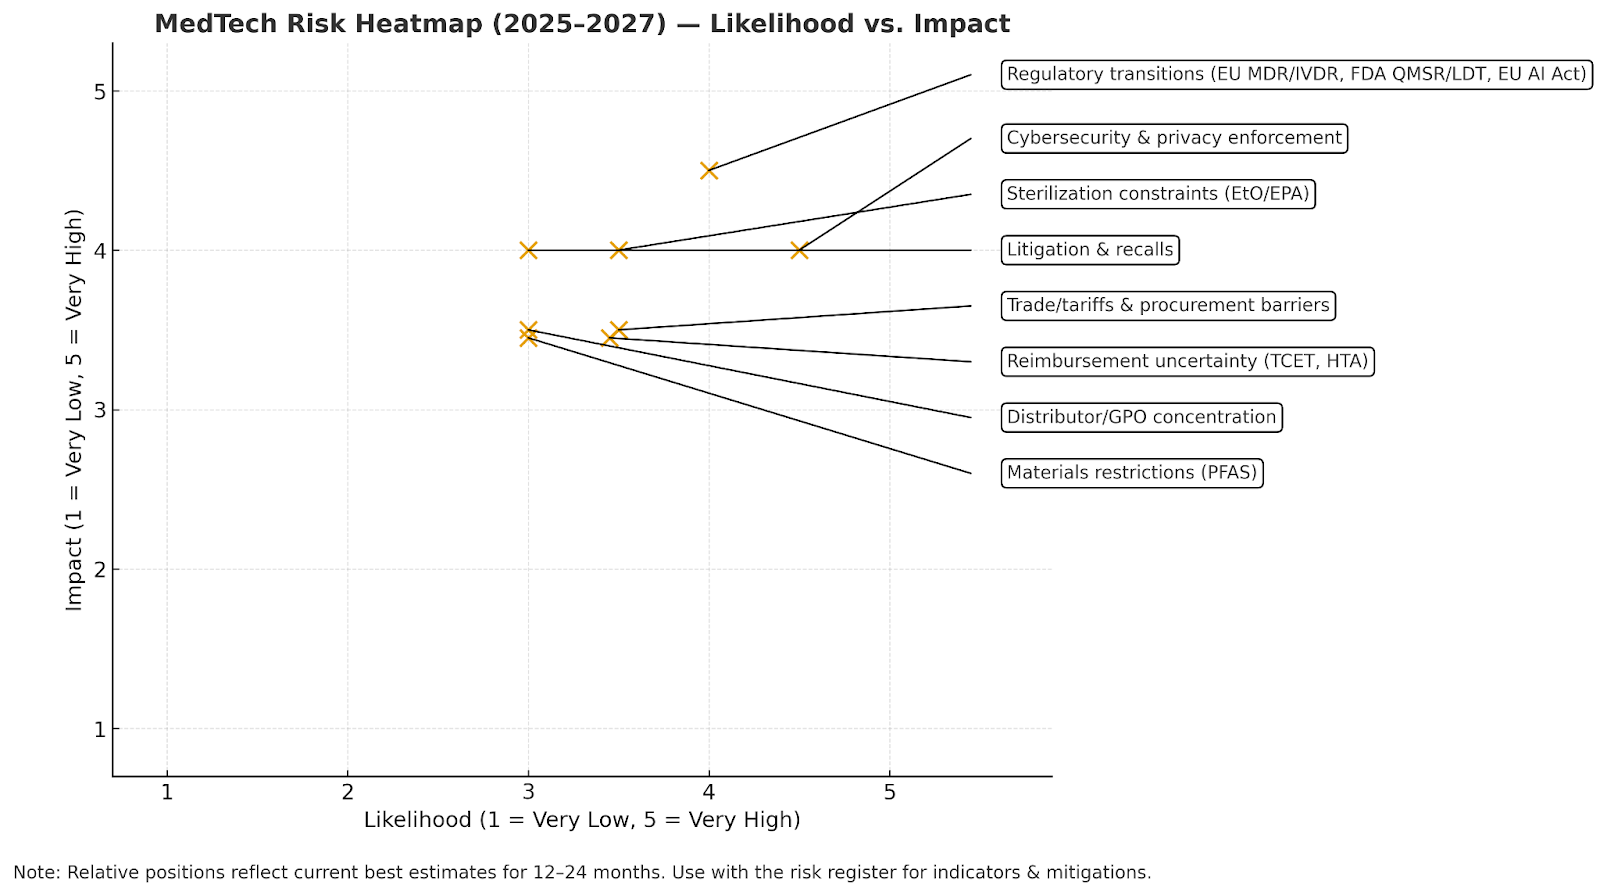
MedTech Risk Heatmap (2025–2027) — Likelihood vs. Impact
Notes on evidence and interpretation
- MDR/IVDR/AI Act: The European Commission’s 2025 survey confirms notified-body counts (50 MDR, 14 IVDR) and ongoing capacity pressures; the EU AI Act is now in force with staggered applicability—high-risk AI embedded in regulated products (e.g., medical devices) must comply by Aug 2, 2027. Digital Strategy
- FDA policies: MDUFA V targets tighter review timelines (e.g., 510(k) shared-outcome goals improve through FY2027); the LDT rule’s phased enforcement is uncertain post the March 31, 2025 district court ruling vacating the rule. U.S. Food and Drug Administration Emergo by UL
- Trade/procurement: 2025 policy actions (U.S. tariff changes; EU limits on Chinese medtech tenders) raise cost/access risk for EU/U.S. buyers and global suppliers. Reuters
- Cyber/privacy: FDA’s cybersecurity expectations plus HIPAA/OCR and FTC’s updated HBNR (effective July 29, 2024) materially increase compliance and incident-response obligations for connected devices and digital health software. Federal Trade Commission
- Reimbursement: CMS’s TCET enables limited, conditional coverage for Breakthrough devices (up to ~5/year), emphasizing evidence development—helpful but not a panacea for payment risk. Jones Day
Strategic Fit & Synergy Opportunities for HOLD.co
Vertical & Horizontal Integration Opportunities
Horizontal (portfolio scale-up / adjacency expansion)
- Roll-ups in fragmented niches (EU/UK focus). Europe counts >37,000 medtech companies and ~90% are SMEs, creating fertile ground to assemble regional leaders in single-use devices, diagnostics accessories, and specialty imaging software. Target clustering can compress commercial costs and raise tender win rates. MedTech Europe
- “Installed-base leverage” in capital equipment & robotics. High installed bases create durable moats and consumables/software pull-through; horizontal acquisitions that add modalities into the same IDNs/GPOs lift cross-sell. (Cross-selling commonly delivers ~20% of revenue-synergy value when executed rigorously.) McKinsey & Company
Vertical (supply, data, and route-to-market control)
- Manufacturing & component assurance. Selective moves into contract manufacturing/packaging or long-term strategic partnerships can secure capacity and quality; investors’ recent tilt toward CMOs underscores the value of resilient, domestic capacity. The Wall Street Journal
- Sterilization resilience. The EPA’s 2024 EtO rule tightened emissions at commercial sterilizers; options include multi-site relationships and co-investments to de-risk release bottlenecks for critical SKUs. hgpii.com
- Demand aggregation via GPOs. U.S. hospital purchasing is highly centralized (e.g., Vizient affiliates cover ~452k staffed beds; Premier ~334k), so adding complementary lines that fit existing contracts multiplies access without duplicating field costs. Definitive Healthcare
Why this fits HOLD.co: A buy-and-build that combines adjacency expansion (horizontal) with selective upstream security (vertical) aligns with today’s PE-heavy healthcare deal mix and the rebound in healthcare M&A capacity in 2025. Bain McKinsey & Company
Portfolio synergies (operations, sales, distribution, tech, data)
| Synergy Area | Integration Move | Data-Anchored Impact | Primary KPIs | Source |
|---|---|---|---|---|
| Commercial (Cross-sell) | Bundle complementary devices/software into existing IDN/GPO accounts | Cross-selling ≈ 20% of revenue-synergy value when executed well | % accounts with ≥2 product lines; attach rates; ASP uplift | McKinsey |
| Route-to-Market | Consolidate contracting through top GPOs and distributor partners | Vizient/Premier networks cover ~452k/334k staffed beds → scale access | Contract coverage; win rate in GPO RFPs; days-to-list | Definitive Healthcare |
| Operations & Supply | Dual-site sterilization & co-investment/long-term capacity agreements | Mitigates EtO bottlenecks post-2024 EPA rule | Sterilization lead time; release failures; OTIF | HGPII 2024 |
| Tech & Data (PMI enabler) | Shared data layer + common CRM/MAP; harmonize device telemetry | Tech & data directly drive ≈ 10% of synergies and enable up to 85% of business synergies | Lead-to-close velocity; service MTTR; data availability SLAs | BCG (2024) |
| GenAI/Automation | GenAI COE for medical writing, service knowledge, and SG&A workflows | MedTech OPEX savings up to 8% and revenue uplift up to 7% by 2027 (survey) | Cost-to-serve; case resolution time; qualified pipeline | BCG (2025) |
| Procurement | Category management across plastics, sensors, packaging; AVL depth | PE interest in domestic CM/packagers signals margin resiliency for secured capacity | PPV; supplier OTIF; single-source % | WSJ (2025) |
Shared-services potential (HR, legal, finance, IT, creative)
- IT/data platform: A shared RevTech stack (CRM/MAP/CDP) with post-merger tech & data as first-class workstream accelerates synergy capture (tech directly ~10% of synergies; enables up to 85% of the rest). Prioritize identity resolution across direct-to-consumer and enterprise lines. BCG
- Regulatory/QA & medical writing desk: Centralize MDR/IVDR & FDA QMSR alignment and clinical/marketing substantiation; leverage GenAI COE to speed document creation with human QA—anchored to the up to 8% OPEX saving potential. BCG Media Publications
- Finance & legal: Common treasury, tax, audit, and MSA templates to compress deal and vendor cycle times; apply synergy-retention discipline (buyers often retain ~50% of synergies in public deals—set targets accordingly). BCG
- Creative & brand studio: Central toolkit for congress playbooks, KOL content, and value-analysis dossiers, tuned to GPO/IDN workflows.
Exit potential & monetization pathways
- Roll-ups
- Thesis: EU/UK fragmentation (~90% SMEs) supports regional roll-ups to platform scale; in the U.S., multi-brand groups with shared GPO channels command premium process interest. MedTech Europe
- IPO/readiness
- Window quality: selective but improving. Healthcare PE set $115B of deal value in 2024 (2nd-highest on record), but IPOs remain selective; medtech IPOs ticked up slightly in H1-2025 (e.g., two U.S. medtech IPOs in Q1; one ≥$15m in Q2), with bankers still cautioning broad IPO waves may lag to 2026. Plan dual-track. Bain, JPMorgan Chase, Business Insider
- Divestiture / carve-outs
- Active buyer interest in contract manufacturing/packaging and select software assets suggests carve-outs can clear at attractive multiples despite uneven public markets. The Wall Street Journal, Reuters
- Strategic sale
- Large-cap medtechs are re-focusing portfolios and pursuing bolder moves in 2025, especially where assets align to their value-creation priorities (quality/innovation pipelines, margin-accretive adjacencies). Position assets with clear roadmap and synergy math. McKinsey & Company
“Where HOLD.co creates the most value” (playbook highlights)
- GPO-centric commercial engine. Centralize contracting and clinical-evidence kits for top systems; measure attach rates and VAC dossier acceptance—start with the largest GPOs by bed coverage for fastest lift. Definitive Healthcare
- Tech-and-data-first PMI. Treat data integration as day-one: unified IDs across devices, service, and marketing drives revenue/cost synergies faster (tech ~10% direct; up to 85% enabled). BCG
- Selective verticalization. Lock sterilization capacity and component supply where constrained (EtO rules; chip/packaging); consider minority JV stakes before full buy to balance capital and control. hgpii.com
- GenAI ops hub. Stand up a shared GenAI capability for SG&A and service knowledge—up to 8% OPEX and up to 7% revenue upside by 2027 if embedded in workflows with governance. BCG Media Publications
- Dual-track exits from day one. Maintain IPO hygiene (audits, KPIs, guidance discipline) while cultivating strategic buyer maps; 2025 IPOs are selective—carve-outs and sponsor-to-sponsor trades remain active. Bain, JPMorgan Chase
Optional embeddable table — “Synergy targets & readiness gates”
| Lever | Target (first 18–24 months) | Readiness Gate | Source |
|---|---|---|---|
| Cross-sell into shared IDNs/GPOs | Revenue synergy: prioritize ~20% of rev-synergy value from cross-sell | Unified account plans; harmonized pricing | McKinsey |
| Tech & data integration | Capture tech-driven synergies (~10% direct; enable up to 85%) | Common data model; single CRM/MAP/CDP; device telemetry pipeline | BCG |
| GenAI shared-service | Up to 8% OPEX and up to 7% revenue upside by 2027 (scenario) | Guardrails (QA review); library of prompts/playbooks | BCG |
| Sterilization & supply assurance | Lead-time variance ↓; zero stockouts on Tier-1 SKUs | Dual-site validations; capacity contracts | HGPII (EtO context) |
| Exit hygiene | Maintain dual-track (IPO/strategic); leverage active HC PE market | Quarterly guidance discipline; carve-out financials | Bain (2025) |
Bottom line for HOLD.co: Build a GPO-centric, tech-enabled platform that acquires in fragmented adjacencies, secures critical supply steps, and standardizes data/GenAI to accelerate synergy capture—while keeping dual-track exits open in a selective but improving capital-markets environment. Definitive Healthcare BCG MedTech Europe Bain
Strategic Recommendations
Acquisition criteria refinement (financial, cultural, operational)
Financial filters (screen-in):
- Public-comp comparable EV/Revenue medians ~4–5x for medtech, varying by subsector—underwrite add-on targets at a discount to listed peers or with clear synergy paths (cross-sell/COGS/SG&A) to bridge to peer multiples. Mercer Capital
- Favor niches with procurement leverage (GPO/IDN fit) and durable recurring mix (consumables, software, service). Use GPO coverage (e.g., Vizient ~452k beds; Premier ~334k; HPG ~184k) to estimate practical market access from day one. Definitive Healthcare
- Price risk into cases where reimbursement is conditional (e.g., CMS TCET—limited slots, evidence requirements). Federal Register Centers for Medicare & Medicaid Services
Cultural/operational filters (deal/do-not-do):
- Quality/regulatory maturity (ISO 13485 alignment; QMSR readiness) and sterilization plan (dual-site or validated partner). EtO rules tighten cost/lead-time; diligence for capacity/resiliency. US EPA
- Data/tech posture (clean CRM/MAP data, product telemetry). Tech & data are now core PMI levers—enable up to ~85% of business synergies and ~10% direct synergies when integrated early. BCG
- Cross-sell adjacency (complementary bag in same buying center). Cross-sell typically contributes ~20% of revenue-synergy value when executed well; build realistic capture plans (many fail without structure). McKinsey & Company
Near-term acquisition targets or partnership suggestions (operator-ready)
- A) Partnerships to secure critical infrastructure (de-risk ops)
- Sterilization capacity: Negotiate multi-year slots or co-investment JVs with large networks (e.g., STERIS AST, Sotera/Sterigenics) to buffer EtO bottlenecks; both report growing sterilization revenue lines. Steris plc Sotera Health Investors
- Contract manufacturing / sensors & interconnects: Establish preferred supplier and co-development MOUs with scaled med-device CM/EMS players (e.g., Integer Holdings, TE Connectivity), aligning to NPI roadmaps and quality gates. Integer Holdings TE Connectivity
- Packaging & sterile barrier systems: Partner with med-device packaging leaders (e.g., Oliver Healthcare Packaging, Nelipak), especially for EU launches (ISO 11607; MDR documentation). Oliver Healthcare Packaging Lincoln International
- B) Add-on buy themes (sub-$250m EV) with procurement pull
- Single-use accessories & components attachable to existing capital base (tubing sets, sterile disposables, sensors). (Rationale: recurring revenue, GPO fit.) Definitive Healthcare
- Enterprise imaging/adjacent clinical software with strong KLAS satisfaction for cross-IDN upsell (PACS/EI remains an active market). (Rationale: committee-based buyers; synergy with installed base.) KLAS Research KLAS Research
- Med-device packaging/clean-room kitting assets in EU/UK to support roll-up in highly fragmented supplier base (Europe has ~37k medtech companies, ~90% SMEs). MedTech Europe
Buy-and-build vs. single-anchor strategy (decision frame)
| Path | When it wins | Prerequisites (hard gates) | Primary risks | Evidence / Source |
|---|---|---|---|---|
| Buy-and-Build (roll-up) | Fragmented niches (EU/UK SMEs); procurement leverage via GPO/IDN bundling; clear cross-sell adjacencies | Platform capable of ≥4 add-ons; cross-sell program; tech/data PMI workstream from Day 1 | Integration drag; antitrust on serial add-ons; over-promised revenue synergies | Bain buy-and-build · McKinsey: cross-sell ≈20% · MedTech Europe (90% SMEs) |
| Single-Anchor (scale asset) | Where a category leader provides installed-base access, reimbursement know-how, and faster path to premium multiple | Anchor with proven tender/GPO wins; strong evidence/HTA file; cash conversion to fund disciplined tuck-ins | Higher entry multiple; fewer inorganic levers if synergy map is thin | Bain GH PE 2025 |
Practical note: Antitrust scrutiny of serial add-ons has increased; plan remedy options and clean, data-backed synergy cases. PitchBook
Strategic capital deployment roadmap (0–6, 6–18, 18–36 months)
| Horizon | Capital Actions | KPI Gates | External anchors (links) |
|---|---|---|---|
| 0–6 months |
• Lock sterilization & packaging capacity (framework agreements/JVs). • Stand up PMI Tech & Data workstream (CRM/MAP/CDP; telemetry pipeline). • Target 1–2 bolt-ons in consumables/components with immediate GPO fit. • Plan reimbursement evidence for pipeline devices; assess TCET potential. |
• Sterilization lead time ≤ X weeks; dual-site validated. • Data readiness: 90-day integration plan; identity resolution live. • ≥30% of revenue under GPO contracts in 9 months. • Evidence plan approved (NCT/RWE design) for 1–2 key SKUs. |
EPA EtO (2024) · BCG PMI Tech · GPO coverage · CMS TCET |
| 6–18 months |
• Execute 2–4 add-ons in EU/UK packaging, kitting, or single-use accessories (roll-up nucleus). • Build cross-sell factory into top 50 IDN/GPO accounts (bundle offers). • Expand OEM partnerships (Integer/TE) for roadmap co-dev & cost downs. |
• Cross-sell revenue ≥ 20% of total revenue-synergy capture plan. • Gross margin +200–300 bps from COGS & mix. • On-time/complete (OTIF) ≥ 95%; scrap/rework down YoY. |
Bain buy-and-build · McKinsey cross-sell · EU SMEs |
| 18–36 months |
• Consolidate EU/UK footprint; consider anchor in enterprise imaging or data-adjacent software (KLAS-validated satisfaction). • Evaluate selective vertical moves (regional sterilization JV; niche CM/packaging tuck-ins). • Prepare dual-track optionality (strategic vs. IPO) based on scale and quality of earnings. |
• Revenue mix: ≥50% consumables/service/software. • Net debt/EBITDA within covenant; FCF conversion ≥ 80%. • Readiness: audited carve-outs; 8–12 quarter KPI history; churn & attach rates improving. |
KLAS vendor performance · Bain GH PE 2025 |
Why this portfolio plan now
- Capital is flowing back to healthcare deals (2024 deal value ~$115B, 2nd highest on record), with buy-and-build and carve-outs central to PE playbooks—conditions favor disciplined platforms with clear synergy math. Bain Bain & Company
- Procurement centralization (GPOs) and EU fragmentation (90% SMEs) create a structurally attractive canvas for bundles + roll-ups. Definitive Healthcare MedTech Europe
- Operations risk (EtO) rewards those who secure sterilization/packaging capacity early; PMI tech/data maturity is now a measurable advantage in realizing synergies. US EPA BCG
Disclaimer: The information on this page is provided by Hold Co for general informational purposes only and does not constitute financial, investment, legal, tax, or professional advice, nor an offer or recommendation to buy or sell any security, instrument, or investment strategy. All content, including statistics, commentary, forecasts, and analyses, is generic in nature, may not be accurate, complete, or current, and should not be relied upon without consulting your own financial, legal, and tax advisers. Investing in financial services, fintech ventures, or related instruments involves significant risks—including market, liquidity, regulatory, business, and technology risks—and may result in the loss of principal. Hold Co does not act as your broker, adviser, or fiduciary unless expressly agreed in writing, and assumes no liability for errors, omissions, or losses arising from use of this content. Any forward-looking statements are inherently uncertain and actual outcomes may differ materially. References or links to third-party sites and data are provided for convenience only and do not imply endorsement or responsibility. Access to this information may be restricted or prohibited in certain jurisdictions, and Hold Co may modify or remove content at any time without notice.
Considering a transaction?
Speak with our team about an acquisition, partnership, or exit — in confidence.