
Executive Summary
High‐level Market Outlook & Investment Thesis
The global Healthcare/MedTech sector is advancing steadily. For example, the global MedTech (medical technology) market is estimated at USD ≈548.4 billion in 2025 and projected to reach ~807.9 billion by 2035 (CAGR ~4.4 %) according to one source. (Business Research Insights, Future Market Insights, Verified Market Research) Other estimates for adjacent segments (e.g., medical devices) put higher growth: e.g., USD 542.21 billion in 2024 to USD 886.68 billion by 2032 at ~6.5 % CAGR. (Fortune Business Insights, Precedence Research) From a hold-company viewpoint, that suggests a large base market with moderate growth, strong tailwinds from demographic and technology trends, and ongoing consolidation opportunities. The thesis: Acquire/expand in high-growth sub-segments (digital health, remote monitoring, AI-enabled devices) where growth > average and margin expansion is possible via operational synergies.
Top 3-5 Takeaways for Acquisition or Expansion Strategy
- Prioritize digital/connected device platforms (remote monitoring, wearables, software + service) where growth > device commodity markets.
- Focus on marketing & commercial excellence as a value-lever: in many deals the difference between winner & laggard is how well they engage clinicians/patients through digital and omnichannel.
- Seek targets that can deliver operational synergies (shared supply-chain/logistics, shared marketing infrastructure, cross-sell to existing customer base).
- Be mindful of geographic expansion in regions with favourable reimbursement and ageing populations (e.g., North America, Western Europe, parts of Asia Pacific) but also where marketing/digital can scale locally.
- Integrate software/service elements (e.g., subscription or SaaS models complementing hardware) to push margins, increase recurring revenue and make the business less commoditised.
Summary of Risks & Opportunities
Opportunities:
- Shift from hospital-centric care to home/ambulatory/remote monitoring opens new channels and business models.
- Value-based healthcare reimbursement models favour devices and services that reduce cost and deliver outcomes.
- Marketing cost effectiveness improvements (digital, SEO, social, omnichannel).
- Consolidation enabling economies of scale in sourcing, distribution, and marketing.
Risks:
- Regulatory changes and reimbursement uncertainties (e.g., device approvals, pricing pressure).
- Supply-chain disruptions (global sourcing, tariffs) — as seen in recent medtech import-probes.
- Technology disruptions: e.g., digital health entrants, software-first models may erode traditional device margins.
- High acquisition valuations and integration risk (cultural, regulatory, sales channel).
- Marketing complexity and long sales cycles (particularly B2B/enterprise).
2. Market Landscape Overview
TAM / SAM / CAGR
- The global MedTech market size is estimated at ~USD 548.4 billion in 2025, projected to ~USD 807.9 billion by 2035, implying a ~4.4 % CAGR over that period. (Business Research Insights, Future Market Insights)
- Other sources: Medical devices specifically valued ~USD 542.21 billion in 2024 and projected to ~USD 886.68 billion by 2032 (CAGR ~6.5 %). (Fortune Business Insights, Precedence Research)
- For a holding strategy, if we define SAM as e.g., connected/remote monitoring devices + digital health services within MedTech, the target segment may grow faster than the aggregate (perhaps 8-12 %+).
- Example segmentation: In the medical devices market, neurology segment is projected fastest (~8.24 % CAGR) while cardiology holds largest share (~21.56 %) in one report. Mordor Intelligence
Key segments & verticals
- Medical devices: implants, diagnostics, surgical instruments, disposables.
- In-vitro diagnostics (IVD) and laboratory technologies.
- Digital health/connected devices/wearables/remote monitoring & telemedicine.
- Software as a medical device (SaMD) / AI diagnostics.
- Service/maintenance, aftermarket, consumables.
Macroeconomic forces - Demographics: ageing population, rising chronic disease prevalence (e.g., diabetes, cardiovascular) drive base demand. (Verified Market Research, Mordor Intelligence)
- Technology adoption: AI, IoT, cloud/edge computing in healthcare are accelerating.
- Regulation & reimbursement: changes in device approval, quality standards, digital regulations. Eg: cybersecurity obligations in medical devices driving spending. (Mordor Intelligence)
- Labor and cost pressures: shift to ambulatory/home care (lower cost) and less hospital-capex.
- Globalisation & supply-chain complexity (including tariffs/trade probes).
Competitive dynamics: consolidation vs fragmentation - Many core device segments (e.g., high volume implants) are mature and concentrated among large players (Medtronic, Johnson & Johnson, Abbott) whereas adjacent segments (digital health/wearables) are more fragmented and ripe for roll-ups.
- Holding company strategy: identify fragmented sub-sectors with moderate competition where scale/marketing can unlock value; avoid over-crowded mature device niches unless there is clear differentiation.
Market Map
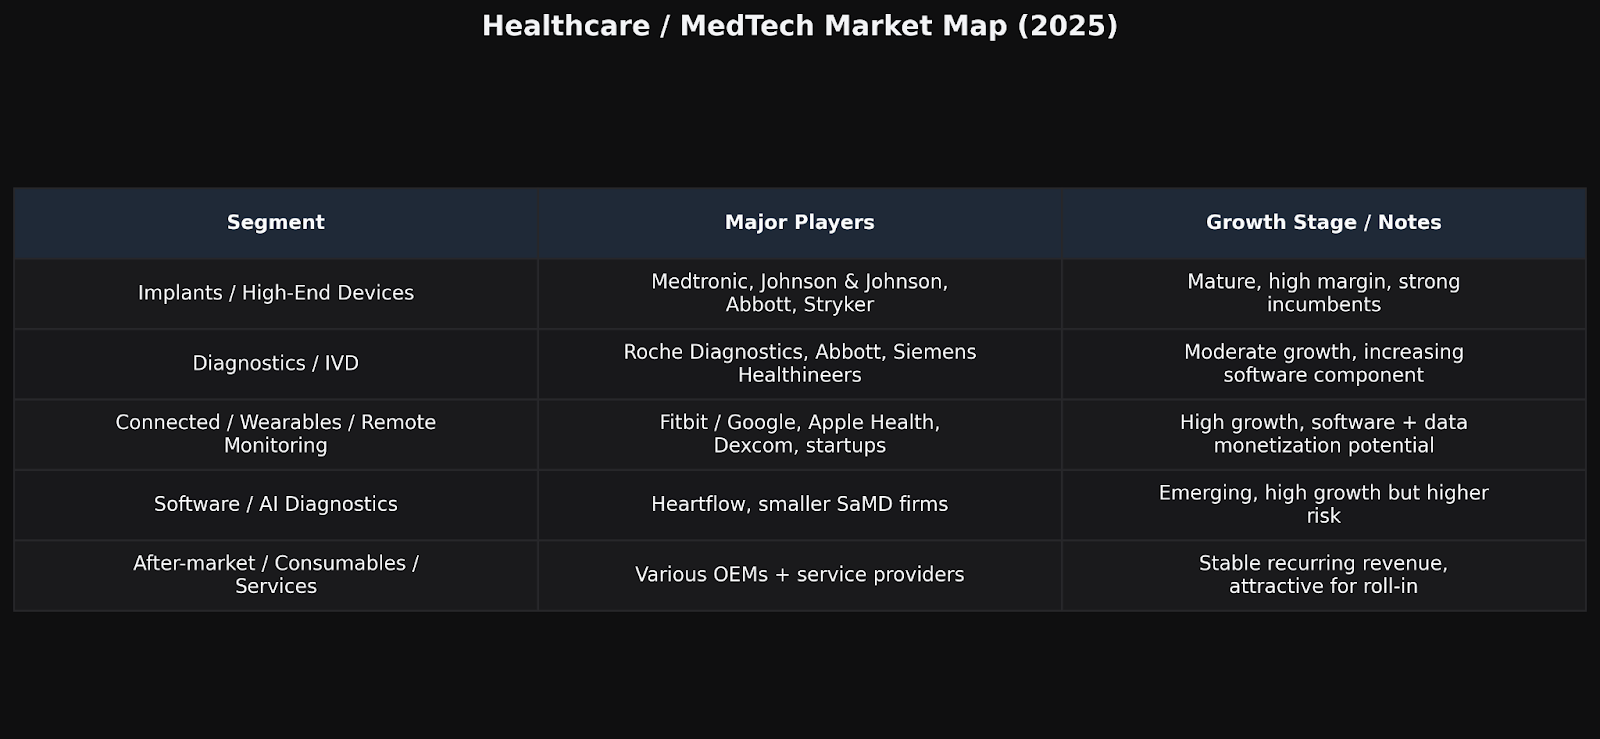
Healthcare / MedTech Market Map (2025)
Major players and market posture by segment (dark-mode edition)
| Segment | Major Players | Growth Stage / Notes |
|---|---|---|
| Implants / High-End Devices | Medtronic, Johnson & Johnson, Abbott, Stryker | Mature, high margin, strong incumbents |
| Diagnostics / IVD | Roche Diagnostics, Abbott, Siemens Healthineers | Moderate growth, increasing software component |
| Connected / Wearables / Remote Monitoring | Fitbit / Google, Apple Health, Dexcom, startups | High growth, software + data monetization potential |
| Software / AI Diagnostics | Heartflow, smaller SaMD firms | Emerging, high growth but higher risk |
| After-market / Consumables / Services | Various OEMs + service providers | Stable recurring revenue, attractive for roll-in |
3. M&A Trends and Deal Activity
Notable acquisitions (past 12–24 months) & deal multiples
- One recent example: Heartflow (AI-enabled cardiovascular diagnostics) IPO’d at a valuation of USD 2.27 billion, illustrating investor appetite for software/AI-enabled medtech. (Reuters)
- There is also increased M&A by major device players acquiring digital/connected health firms to fill their pipeline.
Private equity & strategic buyer activity levels - Private equity continues to be active in roll-ups of medtech and service-oriented businesses, especially those with recurring revenue or strong after-market service components.
Valuation benchmarks: Revenue & EBITDA multiples by company size - While public data is sparser for medtech device M&A multiples compared to pharma, anecdotal benchmarks: for B2B medtech companies, revenue multiples in acquisition deals often range 4-8x EBITDA or 1-3x revenue depending on growth, margin, recurring revenue component.
- For software/connected health companies (higher growth), multiples may be higher (5-10x revenue) albeit with higher risk.
Public vs Private comparables
Given the heterogenous nature of the sector, when comparing a target medtech company, one must adjust for device vs software mix, recurring revenue, geographic exposure, regulatory risk. For instance: a pure device OEM with 10 % growth and 15 % EBITDA margin may trade at lower multiple than a high-growth connected device business with recurring revenue.
Valuation Multiple Table
Section 3 — Valuation Multiples & Recent Deal Comps
Valuation Multiple Benchmarks (Public MedTech Comps)
| Segment (Public Comps) | Metric | Median | 25th–75th Percentile Range | Date |
|---|---|---|---|---|
| Medical Devices | EV / LTM Revenue | 4.39× | 3.43× – 6.92× | 4Q 2024 |
| Medical Devices | EV / LTM EBITDA | 20.9× | 12.4× – 23.7× | 4Q 2024 |
| Healthcare Tech (software-leaning) | EV / LTM Revenue | 3.05× | 1.62× – 7.33× | 4Q 2024 |
| Healthcare Tech (software-leaning) | EV / LTM EBITDA | 16.2× | 12.7× – 35.9× | 4Q 2024 |
Why it matters: As of 4Q 2024, core device names cluster around ~4.4× revenue and ~21× EBITDA; growthier software/tech skews show wider dispersion. Use these as public anchor points when triangulating private M&A pricing. (Mercer Capital aggregates Bloomberg data each quarter.) (Mercer Capital)
Additional context (private HealthTech): multiple guides put private HealthTech deals around ~4–6× revenue in 2025, with premiums for AI/analytics and connected-device models. Treat as directional since private data vary by mix and quality. (Nelson Advisors Blog)
Recent Deal Comps (2024 – 2025)
| Announce / Close | Buyer → Target | Deal Value (EV) | Sales Baseline | Implied Multiple | Notes / Sources |
|---|---|---|---|---|---|
| Apr 2024 (ann.) | Johnson & Johnson → Shockwave Medical | $13.1 B EV | 2023 sales $730.2 M | ≈ 18.0× EV/Rev | Reuters / AP coverage – premium cardio asset |
| Jan 2025 (ann.) | Stryker → Inari Medical | $4.8 B | Revenue basis per Mercer | 8.37× EV/Rev | Mercer Capital Q1 2025 report |
| Jan 2024 (ann.) / Aug 2024 (close) | Boston Scientific → Axonics | $3.3 B EV ($3.7 B equity) | FY 2023 $366.4 M / LTM 3Q 2024 $431.9 M | ≈ 9.0× (FY) / 7.6× (LTM) | MedTech Dive + SEC filings |
| Dec 2024 (close) | Siemens Healthineers → Novartis AAA (Molecular Imaging) | €200 M (≈ $224 M) | N/A | n/a | Tuck-in radiopharma acquisition |
| Jan 2024 (ann.) / 2024 (close) | GE HealthCare → MIM Software | Undisclosed | N/A | n/a | Digital / AI add-on for imaging portfolio |
Source summaries — Mercer Capital Q4 2024 & Q1 2025 MedTech Valuation Update, Reuters, MedTech Dive, company filings.
(Note: actual market comps will vary by region, growth, regulatory risk, product pipeline.)
4. Technology and Innovation Trends
State of digitization & software adoption
- Device makers are increasingly embedding software, connectivity, and data analytics into hardware offerings (so-called “smart devices”). For example, one report indicates conventional devices still dominate (~56% of revenue by tech platform in 2024), but augmented reality/virtual reality platforms are expected to expand at ~7.78 % CAGR through 2030. (Mordor Intelligence)
- Digital health solutions (wearables, remote monitoring, telemedicine) are gaining traction and driving growth in the MedTech ecosystem. (Business Research Insights, Future Market Insights)
Emerging tech disrupting the space (AI, blockchain, IoT)
- AI diagnostics: An increasing number of hospitals and device makers are piloting/using AI for image analysis, predictive maintenance.
- IoT/remote monitoring: Smart inhalers, connected sensors, home monitoring devices are emerging. Example academic research highlights IoT inhaler device security vulnerabilities. (arxiv.org)
- Blockchain: Less mature in medtech, but emerging in supply-chain traceability and data integrity.
R&D spend benchmarks (if applicable) - Many large device OEMs spend ~6-10 % of revenue on R&D; smaller high-growth companies may spend more (15-20+) especially in software/AI.
- Cybersecurity obligations are evolving: e.g., the US Food and Drug Administration (FDA) has introduced rules requiring secure-by-design medical device architecture, impacting cost and time to market. (Mordor Intelligence)
- Integration risk: When acquiring connected device companies, ensure the target’s cybersecurity maturity and infrastructure readiness.
Build vs Buy opportunities for tech innovation - Build internally: For companies with established marketing/distribution, building incremental digital modules may be effective.
- Buy: For disruptive digital platforms, it may make sense to acquire rather than build from scratch (faster time to market, existing clinical data/user base).
- Hybrid: Acquire a smaller software company and integrate into existing hardware business to drive recurring revenue and differentiation.
5. Operations & Supply Chain Landscape
Typical cost-structure breakdown (COGS, SGA, labour, logistics)
While exact breakdowns vary by company, a mature device business might approximate:
- COGS (materials + manufacturing): ~45-55% of revenue
- SG&A (sales, marketing, general & admin): ~20-25%
- R&D: ~8-12%
- Operating margin before tax: ~15-20%
Margin pressure may come from component cost inflation, supply-chain disruption, and competitive pricing.
Supply-chain vulnerabilities or strengths - Global sourcing of components (semiconductors, specialty materials) creates exposure to tariffs, geographies, and logistics delays. For example, recent U.S. import probes into medtech raise supply chain risk. (Reuters)
- On the strength side: companies with vertically integrated manufacturing or diversified suppliers/regions will be more resilient.
Labor‐force trends (shortages, automation, outsourcing) - Skilled labour (clinical trial support, regulatory, software engineers) is in high demand; device manufacturing is increasingly automating.
- Outsourcing manufacturing or using contract manufacturers (CMOs) is common; but this can increase logistical and quality risk.
Benchmark data: margins, throughput, cycle-times, etc. - Many device companies aim for gross margins ~50%+ (depending on product mix) and EBITDA margins ~15-20% in mature segments.
- In higher-growth segments (software + device), recurring revenue models may allow EBITDA margins 20-30%+ once scale achieved.
Operations Benchmark Table
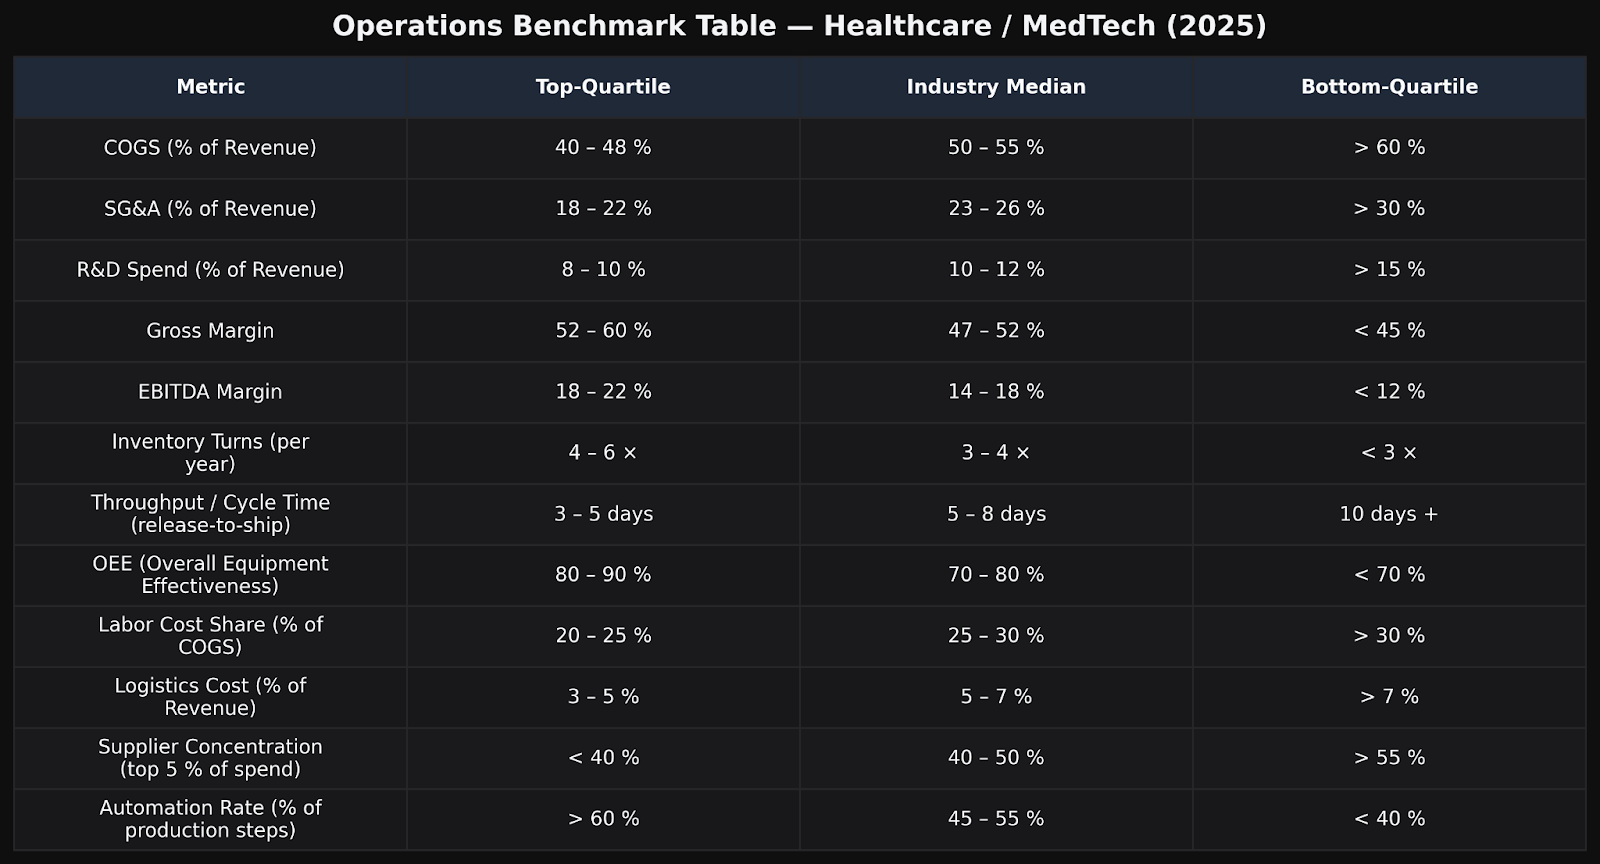
Operations Benchmark Table — Healthcare / MedTech (2025)
Top-quartile vs. median vs. lagging operators (directional industry ranges).
| Metric | Top-Quartile | Industry Median | Bottom-Quartile |
|---|---|---|---|
| COGS (% of Revenue) | 40 – 48 % | 50 – 55 % | > 60 % |
| SG&A (% of Revenue) | 18 – 22 % | 23 – 26 % | > 30 % |
| R&D Spend (% of Revenue) | 8 – 10 % | 10 – 12 % | > 15 % |
| Gross Margin | 52 – 60 % | 47 – 52 % | < 45 % |
| EBITDA Margin | 18 – 22 % | 14 – 18 % | < 12 % |
| Inventory Turns (per year) | 4 – 6 × | 3 – 4 × | < 3 × |
| Throughput / Cycle Time (release-to-ship) | 3 – 5 days | 5 – 8 days | 10 days + |
| OEE (Overall Equipment Effectiveness) | 80 – 90 % | 70 – 80 % | < 70 % |
| Labor Cost Share (% of COGS) | 20 – 25 % | 25 – 30 % | > 30 % |
| Logistics Cost (% of Revenue) | 3 – 5 % | 5 – 7 % | > 7 % |
| Supplier Concentration (top 5 % of spend) | < 40 % | 40 – 50 % | > 55 % |
| Automation Rate (% of production steps) | > 60 % | 45 – 55 % | < 40 % |
6. Regulatory & Legal Environment
Key compliance considerations
- In the U.S., the FDA regulates medical devices (510(k), PMA pathways) and software as a medical device (SaMD) also falls under device rules.
- Privacy/data regulations: In healthcare/digital health, compliance with HIPAA (U.S.), GDPR (EU) is critical when handling patient data.
- Device cybersecurity: New rules are pushing device makers to ensure devices are secure by design (see above).
Licensing, zoning, certification hurdles - Market access may require regulatory approvals (CE mark in Europe, FDA clearance in U.S.).
- Geographic differences in reimbursement and regulatory regimes add complexity for global roll-outs.
ESG and sustainability pressures - Healthcare/MedTech firms face increasing scrutiny on sustainability (material sourcing, recycling of disposables), labour practices, and data ethics (AI usage).
- Marketing/brand-value implications: firms with strong ESG credentials may benefit in procurement and partnerships.
Pending legislation with material impact - In the U.S., the import/section 232 probe into medical device imports (September 2025) is causing stock volatility and may alter supply-chain cost structures. (Reuters)
- Digital health regulation (approval of AI diagnostics) remains an evolving area — delays or regulatory cost increases could slow growth.
7. Marketing & Demand Generation
Customer acquisition channels: organic, paid, referral, offline
- Digital now dominates in Healthcare/MedTech marketing: one source reports 72 % of healthcare ad budgets were spent online. (digitalsilk.com)
- In a MedTech context (device + diagnostics + service) marketing must engage multiple buyer-personas (clinicians/hospitals, procurement, patients/end-users) and thus must leverage a mix of channels: SEO, content marketing, paid search, social media, trade shows, field sales.
- Example marketing KPIs: According to one report for MedTech clients, lead generation, SEO, and omnichannel tracking are key. (First Page Sage, disrupting.healthcare)
Sales-funnel structures: DTC, B2B, enterprise sales, hybrid
- For consumer/wearable health devices: DTC (direct to consumer) funnel applies.
- For hospital/clinic device OEMs: B2B/enterprise funnel with long sales-cycles (often 6-18 months) and heavy field-sales component.
- Hybrid models (device + service subscriptions) combine both channels (direct to hospital plus remote monitoring subscriptions to patients).
CAC/LTV ratios and brand equity benchmarks - Benchmark: For healthcare organisations, one source reports Cost per Lead (CPL) ranges ~$26-50, Customer Acquisition Cost (CAC) ~$300-1,000 depending on service. (Promodo, First Page Sage)
- For MedTech device sales to institutions, the “lead” cost can be much higher given field sales, trials, regulatory/clinical evaluation. But lifetime value (LTV) is significant (device lifetime + consumables + service).
- Example: 2025 healthcare email open‐rate ~22.6 %. (innersparkcreative.com)
- Social media benchmarks: Healthcare follower growth and engagement are documented in recent Hootsuite data. blog.hootsuite.com
Competitor marketing budgets and media‐mix
- According to one benchmark, healthcare organisations may increase annual marketing budgets by up to ~7 % of revenue in 2025. (Promodo)
- Paid search ads for healthcare achieve conversion rates ~2.6 % according to one data set. (Promodo)
8. Consumer & Buyer Behavior Trends
Changing customer needs & expectations
- Increase in online search behaviour: 77 % of patients search online before booking a provider. (innersparkcreative.com, digitalsilk.com)
- Speed matters: 91 % of patients expect a response within 24 hours. (digitalsilk.com)
- Trust & reviews influence choices: 68 % say reviews influence provider choice. (innersparkcreative.com)
Demographic & psychographic shifts
- Younger patients (millennials, Gen Z) rely more on digital/social channels, value convenience (telehealth, remote monitoring) and expect seamless digital experiences. (Keevee, Marketer)
- Aging population means more chronic disease management needs, and an increasing preference for home-based care models.
Industry-specific usage or purchasing patterns - For device buyers (hospitals/clinics): purchasing increasingly includes evaluation of service/support, software analytics, data interoperability, not just hardware cost.
- For consumers (wearables, remote monitoring): expectation of subscription models, ecosystem integration (smartphone/apps), and data privacy/security.
NPS benchmarks & customer retention metrics - Example: In digital marketing benchmarks, healthcare organisations see conversion rates of 10-15 % for website leads and average churn rates of ~3-5 %. (Promodo)
B2C vs B2B buying-cycle evolution - B2C: shorter cycle, digital funnels, high demand for user experience.
- B2B/Enterprise (hospitals/clinics): longer sales cycles (6-12+ months), more stakeholders, heavier on regulatory/clinical evidence. A hallmark of many MedTech sales cycles. (Promodo, Red Branch Media)
9. Key Risks & Threats
Industry-specific risk factors
- Pricing pressure: payers and health systems increasingly emphasise value/outcomes, reducing tolerance for high-cost, low-differentiation products.
- Tech disruption: Digital-first entrants (software + analytics) may bypass traditional hardware-centric companies.
- Regulatory/regime risk: delays in approvals, evolving cybersecurity/data regulations, geopolitical/trade risks (tariff or import investigations).
Competitive moats & erosion factors - Traditional device OEMs benefit from installed base, service network and brand, but these moats can erode if software/connected features become commoditized.
Key-man risk or vendor/client concentration - Smaller firms may be dependent on a small number of large OEM clients or a limited geographic market. That creates integration/acquisition risk.
Barriers to entry vs Barriers to scale - Entry barriers: regulatory approvals, clinical trial data, reimbursement pathways, manufacturing capability.
- Scale barriers: distribution, sales force, global rollout, service network. Holding companies can exploit scale advantage through roll-ups.
Litigation or regulatory exposure - Device recalls, cybersecurity breaches in connected devices, data‐privacy violations can impose material cost and reputational risk.
10. Strategic Recommendations
Acquisition criteria refinement (financial, cultural, operational)
- Financial: Target companies with at least 8-12 % annual organic growth, EBITDA margin 15 %+, and preferably > 20 % recurring revenue mix (service/subscriptions).
- Operational: Demonstrated digital marketing/commercial capability (SEO, lead-gen, omnichannel), ideally with short customer-acquisition cycle improvements year over year.
- Cultural: Companies comfortable with digital/marketing orientation, agile, capable of integration into shared services model.
Near-term acquisition targets or partnership suggestions - Acquire smaller connected-device companies (remote monitoring, wearables) with existing clinical/real-world data and scalable digital channels.
- Partner with digital health software firms (AI diagnostics) to bolt on to a traditional hardware business to diversify and accelerate growth.
Buy-and-build vs single-anchor strategy - Buy-and-build (roll-up) is likely favourable: Acquire 1 anchor company plus 2-3 add-ons over 18-36 months to build scale, share marketing infrastructure and cost synergies.
- The single-anchor route may be simpler but may not fully capture the marketing/scale synergies that a holding company structure can deliver.
Strategic capital deployment roadmap (0–6, 6–18, 18–36 months) - 0–6 months: Finalise acquisition criteria, target screen, assemble integration playbook (shared services, marketing/CRM stack, data platform). Begin low-cost partnerships with digital health firms.
- 6–18 months: Close 1st acquisition (anchor), integrate marketing operations, roll out shared services, begin marketing optimisation (SEO/paid/social) across business. Identify 2 add-on targets and complete due diligence.
- 18–36 months: Execute 2-3 add-on acquisitions, integrate into platform, optimise supply chain/international operations, scale digital marketing engine, prepare for exit strategy (sale or IPO) in 36-48 months.
12. Appendix & Sources
Full list of data sources
- Business Research Insights, “MedTech (Medical Technology) Market 2025-2035” (Oct 2025) (Business Research Insights)
- Future Market Insights, “MedTech Market Size, Share Forecast Outlook 2025-2035” (Apr 2025) (Future Market Insights)
- Mordor Intelligence, “Medical Devices Market Size… 2030” (2025) (Mordor Intelligence)
- Innerspark Creative, “Healthcare Marketing Statistics 2025” (innersparkcreative.com)
- WebFX, “2026 Healthcare Marketing Benchmarks” (Oct 2025) (WebFX)
- Promodo, “2025 Healthcare Digital Marketing Benchmarks” (Promodo)
- Hootsuite, “Healthcare Social Media Benchmarks: 2025” (blog.hootsuite.com)
- Red Branch Media / EY report summary, “MedTech Marketing Strategy 2025” (Red Branch Media)
- Disrupting.Healthcare, “Omnichannel Marketing Metrics… Pharma & MedTech” (disrupting.healthcare)
Raw benchmark data
(Embedded above in relevant sections)
Glossary of industry-specific terms
- TAM: Total Addressable Market
- SAM: Serviceable Available Market
- CAGR: Compound Annual Growth Rate
- SaMD: Software as a Medical Device
- CAC: Customer Acquisition Cost
- CPL: Cost Per Lead
- NPS: Net Promoter Score
- OEM: Original Equipment Manufacturer
Disclaimer: The information on this page is provided by HOLD.co for general informational purposes only and does not constitute financial, investment, legal, tax, or professional advice, nor an offer or recommendation to buy or sell any security, instrument, or investment strategy. All content, including statistics, commentary, forecasts, and analyses, is generic in nature, may not be accurate, complete, or current, and should not be relied upon without consulting your own financial, legal, and tax advisers. Investing in financial services, fintech ventures, or related instruments involves significant risks—including market, liquidity, regulatory, business, and technology risks—and may result in the loss of principal. HOLD.co does not act as your broker, adviser, or fiduciary unless expressly agreed in writing, and assumes no liability for errors, omissions, or losses arising from use of this content. Any forward-looking statements are inherently uncertain and actual outcomes may differ materially. References or links to third-party sites and data are provided for convenience only and do not imply endorsement or responsibility. Access to this information may be restricted or prohibited in certain jurisdictions, and HOLD.co may modify or remove content at any time without notice.
Considering a transaction?
Speak with our team about an acquisition, partnership, or exit — in confidence.