
The global information technology and software sector is entering an investment-led expansion cycle fueled by AI infrastructure buildouts, resilient enterprise software demand, and cloud distribution at scale. Worldwide IT spend is projected to reach roughly $5.4T in 2025 with software outgrowing the market and data-center systems spiking on AI readiness ( Gartner via TechRadar ).
Public cloud infrastructure services alone approached ~$99B in Q2-2025 (~25% YoY), reinforcing marketplaces and co-sell as primary go-to-market levers ( Synergy Research Group ). At the application layer, forecasts point to sustained revenue expansion through 2028 as AI features augment—rather than cannibalize—core software categories ( IDC; IDC FutureScape ).
Buying committees are becoming more proof-driven and security-sensitive, with recent survey data showing rapid AI software adoption and heavy weighting of trust signals (breach history, compliance, third-party reviews) in vendor selection ( G2 Buyer Behavior 2024 ).
For HOLD.co, this backdrop favors control positions in AI-enabled applications and the “operate-better” stack (governance, security, FinOps, data/automation) where measurable ROI, marketplace distribution, and best-in-class trust posture translate directly into CAC efficiency, NRR, and durable cash generation.
High-level market outlook & investment thesis
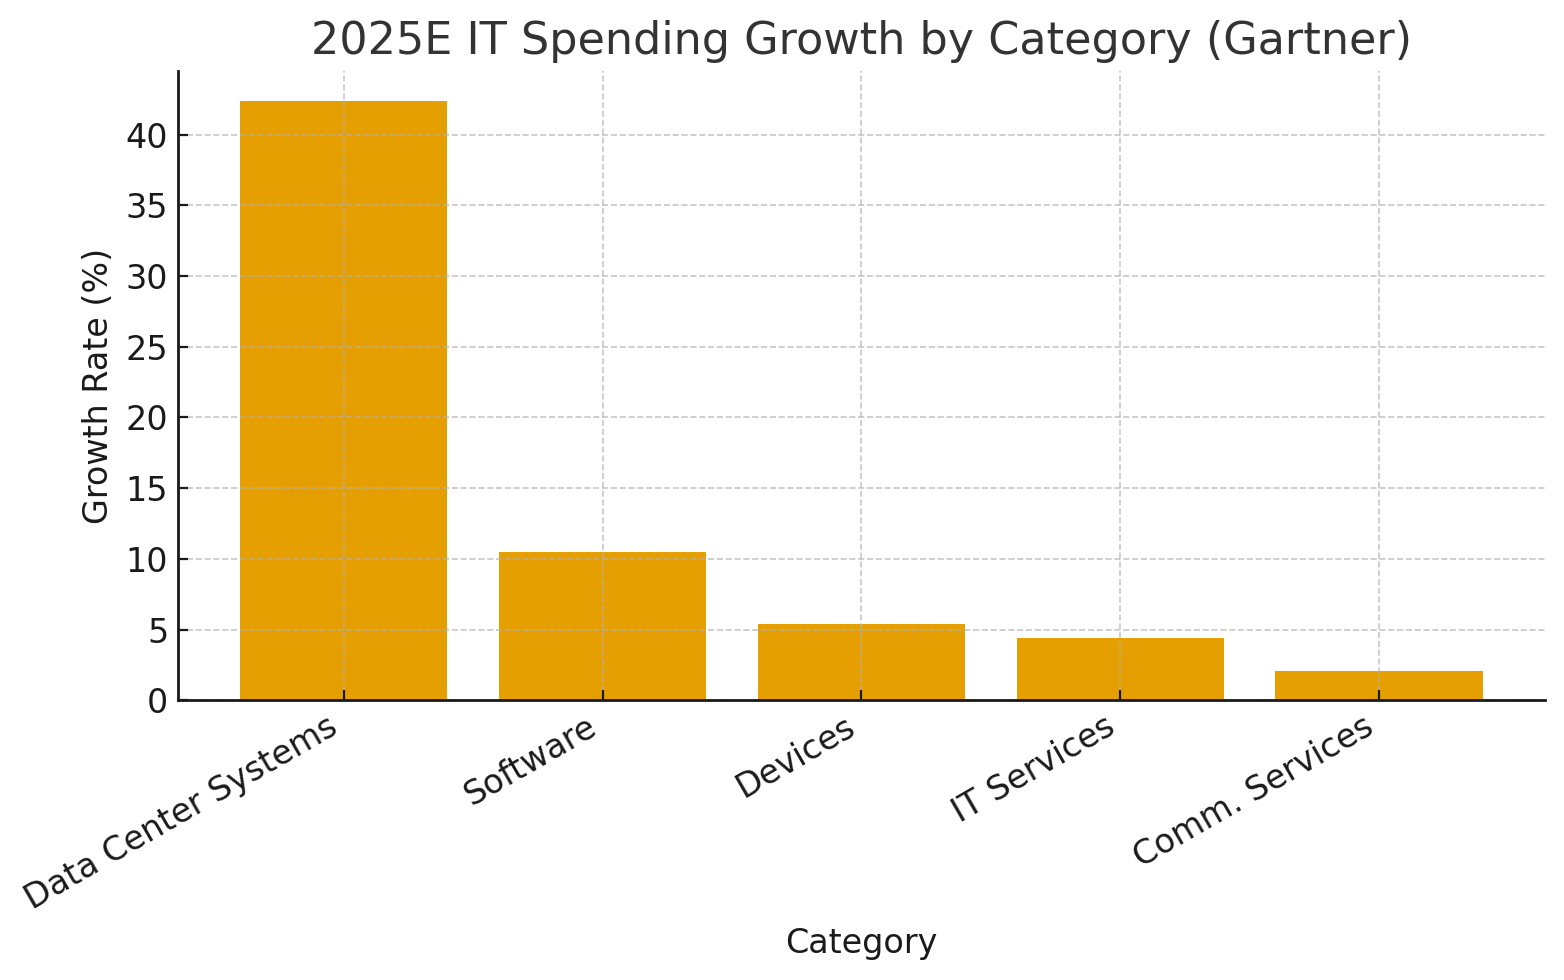
Global IT outlays are set to reach $5.43T in 2025 (+7.9% YoY), with software projected to grow ~10.5% and data center systems a striking +42.4% as AI-ready infrastructure drives capex. This creates a dual engine: (1) resilient, recurring software demand, and (2) hyperscaler-led AI/infra buildouts that lift adjacent tooling (data, security, MLOps, FinOps). For HOLD.co, the investment thesis centers on acquiring/control positions in AI-enabled software (horizontal and vertical), cloud cost & security platforms, and data/automation layers with durable net retention and operating leverage. (CIO Dive; TechRadar)
Cloud remains the distribution backbone: Q2-2025 cloud infrastructure services neared $99B for the quarter (~24–25% YoY), signaling sustained shift to usage-based, platform go-to-market and strong co-sell opportunities with hyperscalers/marketplaces. (Synergy Research Group)
AI demand is no longer speculative: enterprise AI solution spend is forecast at ~$307B in 2025 and ~$632B by 2028, while enterprise applications revenue grew 12% in 2023 and is on track to surpass $600B by 2028, showing that AI is augmenting—not replacing—core software budgets. (IDC FutureScape; IDC)
Buyer behavior is shifting toward faster, proof-driven decisions: more than half of B2B buyers purchased AI software in the last 3 months and rely heavily on trusted reviews/security posture—a tailwind for product-led, self-serve, and review-driven demand capture. (G2 Buyer Behavior 2024)
Quick chart — 2025E IT spending growth by category (Gartner)
Key signals driving HOLD.co’s interest in IT & Software
- Budget gravity toward AI & infra: AI buildouts are expanding total spend rather than cannibalizing software; data center systems up ~42% while software still outgrows overall IT. (TechRadar)
- Cloud scale & co-sell leverage: With quarterly cloud spend near $99B, partnering/marketplacing with hyperscalers accelerates distribution and lowers CAC for portfolio assets. (Synergy Research Group)
- Durable enterprise apps: Enterprise applications growth and long-term forecasts (> $600B by 2028) underpin sticky ARR with expansion vectors via AI features/agents. (IDC)
- Buyer velocity & proof pressure: B2B buyers expect fast ROI; 56% bought AI software recently and 81% factor breach history, rewarding vendors with credible security and measurable outcomes. (G2 Research Hub)
Top 3–5 takeaways for acquisition or expansion strategy
- Prioritize AI-enabled software with measurable ROI (time-to-value < 90 days) in data, security, automation, and FinOps—where spend is expanding alongside cloud/AI infra. (srgresearch.com, IDC)
- Exploit hyperscaler channels (AWS/Azure/GCP marketplaces, co-sell) to compress CAC and accelerate enterprise penetration as cloud spend scales. (srgresearch.com)
- Bet on “operate better” tooling—FinOps, governance, and security—aligned with cost optimization (a top cloud challenge) and breach-sensitive buying. (sc102-prod-cd.azurewebsites.net, Flexera, G2 Research Hub)
- Lean into vertical SaaS with clear domain moats where AI adds decisioning/agentic workflows (not just copilots), sustaining premium NRR as AI features become table stakes. (IDC)
- Build review-led demand capture (G2/peer proof, security transparency) to match how buyers actually shortlist and purchase. (G2 Research Hub)
Summary of risks & opportunities
Opportunities
- AI-driven upsell across installed bases as AI becomes a default feature in software; software category still outgrowing total IT. TechRadar
- Marketplace distribution to reduce sales friction and improve cash conversion. srgresearch.com
- Roll-ups in fragmented sub-verticals (Ops, Dev tooling, data integrity) given robust end-market growth and buyer consolidation of vendors. IDC
Risks
- Hype-cycle hangover: Gartner flags generative AI entering a “trough of disillusionment” as 2024 pilots underdelivered; pipeline quality diligence is critical. IT Pro
- Cloud platform dependency: Pricing and margin pressure tied to hyperscaler economics and capex cycles; vendor terms can shift rapidly. srgresearch.com
- Security & compliance scrutiny: Breach histories materially influence win rates; portfolio must over-invest in security, governance, and auditability. G2 Research Hub
2025–2026 snapshot
| Indicator | Latest / 2025E | Notes | Source |
|---|---|---|---|
| Worldwide IT Spending | $5.43T (+7.9% YoY, 2025E) | Macro resilience; AI-led budgets | Gartner via CIO Dive |
| Data Center Systems Growth | +42.4% (2025E) | AI-ready infra drives capex surge | Gartner via TechRadar |
| Software Spending Growth | ~+10.5% (2025E) | Software outgrowing overall IT | Gartner via TechRadar |
| Cloud Infra Services (Q2-2025) | ~$99B for the quarter (~24–25% YoY) | Sustained acceleration; AI workloads | Synergy Research Group |
| Enterprise AI Solution Spend | ~$307B (2025), ~$632B (2028E) | Rapid adoption/expansion path | IDC FutureScape |
| Enterprise Apps Revenue | +12% (2023); >$600B by 2028E | Core software remains durable | IDC Press Release |
| Buyer Behavior (B2B software) | 56% bought AI software in last 3 months | Security reputation heavily weighted | G2 Buyer Behavior 2024 |
Expert commentary (what this means for HOLD.co)
- Software + AI is additive: Despite AI hype volatility, spend patterns show AI augmenting core software categories, not displacing them—supporting a buy-and-build strategy around AI-enhanced workflows. TechRadar IDC
- Distribution beats features: In crowded AI/software categories, marketplace presence and security credibility increasingly determine win rates and CAC payback. srgresearch.com G2 Research Hub
- Proof over promise: With Gartner noting early AI project failures, acquisition targets must demonstrate measurable outcomes (time saved, risk reduced, cost optimized) rather than “feature parity.” IT Pro
Market Landscape Overview — Information Technology & Software
TAM, SAM, and growth snapshot (CAGR)
| Scope | 2025 Size | Growth/CAGR | Notes | Source |
|---|---|---|---|---|
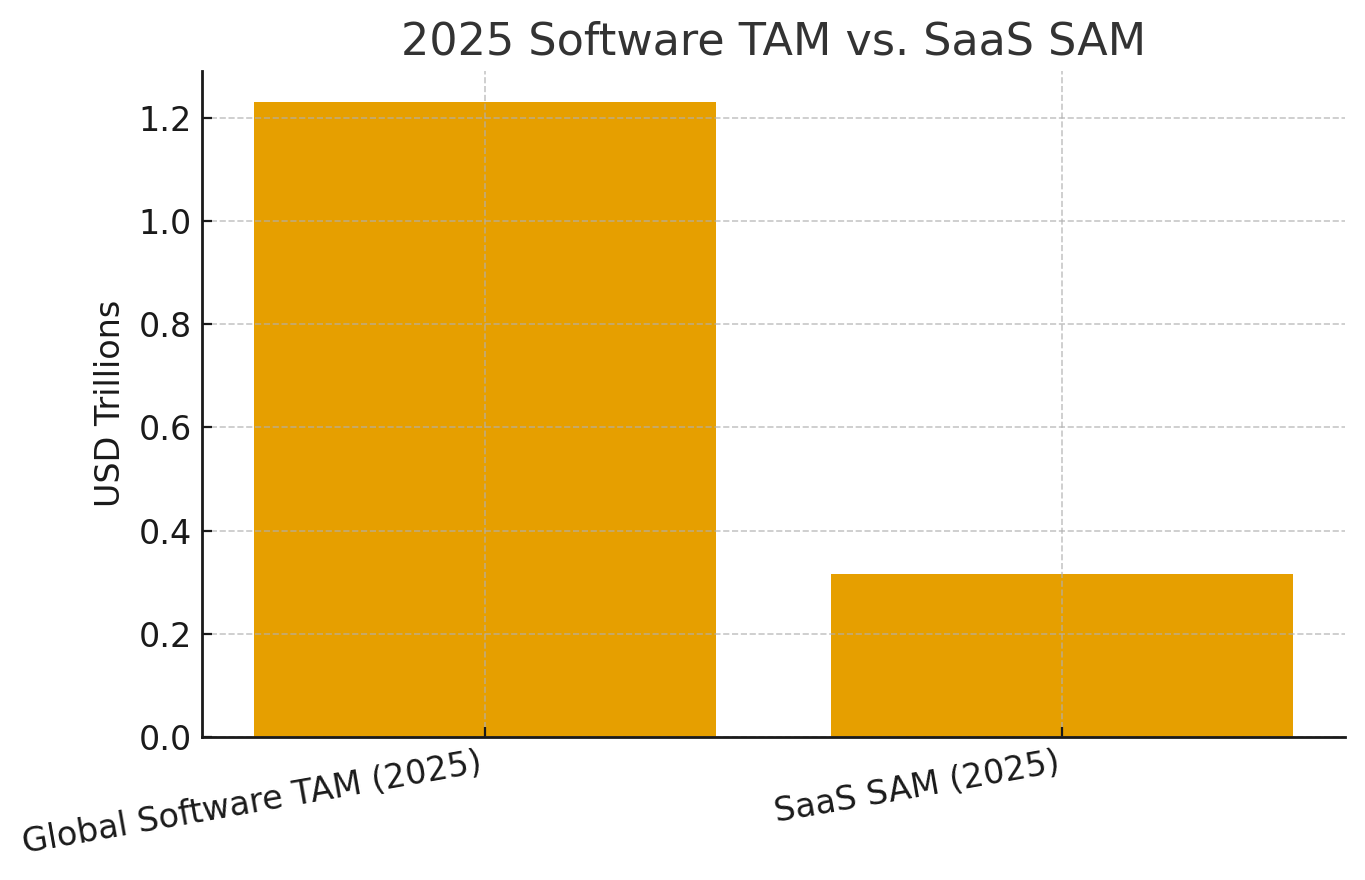
| Global Software TAM | ~$1.23T (2025E) | +10.5% YoY (’25) | Software outgrowing total IT; durable enterprise demand | Gartner (via ITPro Today) |
| Serviceable Available Market (SaaS) | ~$316B (2025E) | ~20% CAGR (’25–’32) | B2B SaaS addressable via PLG + enterprise sales | Fortune Business Insights |
| Adjacent tailwind: Cloud infra services | ~$99B (Q2’25 quarterly run-rate) | ~25% YoY (Q2’25) | Distribution + co-sell leverage for software | Synergy Research Group |
Context: Gartner’s 2025 forecast also pegs total IT spend at $5.43T (+7.9%), with data center systems +42.4% and software +10.5%—key demand drivers for software and data/AI tooling. TechRadar
Quick visual: 2025 Software TAM vs. SaaS SAM
Key segments & verticals within the industry
| Segment | What it includes | 2025 signal | Representative leaders (links) | Reference |
|---|---|---|---|---|
| Cloud Platforms & Infra SW | IaaS/PaaS control planes, container/K8s, observability | Q2’25 cloud services ~$99B/qtr, ~25% YoY | AWS, Azure, Google Cloud | Synergy Research |
| Data & AI Platforms | Warehouses/lakes, MLOps, analytics, AI platforms | Software is >50% of AI spend in most years | Snowflake, Databricks, Vertex AI | IDC AI Spending |
| Enterprise Applications | CRM, ERP, HCM, finance, ITSM, CX | Market >$600B by 2028; +12% growth in 2023 | Salesforce (CRM), SAP / Oracle (ERP), ServiceNow (ITSM) | IDC Enterprise Apps, IDC CRM rank (Salesforce) |
| Security Software | Identity, endpoint, cloud, data security, backup/DR | Global cybersecurity spend $213B (’25E) | CrowdStrike, Palo Alto, Veeam | Gartner via ITPro, Gartner backup share |
| Vertical SaaS | Industry-specific apps (health, manufacturing, public sector, fintech, logistics) | Fast-growing subsegment within SaaS | IFS, Infor, Guideline (examples) | IDC MarketScape (IFS), IDC MarketScape (Infor) |
Enterprise apps remain a large, resilient pool (IDC), while cloud platforms provide the distribution backbone and co-sell leverage at scale (Synergy). Security continues to expand alongside AI workloads and hybrid cloud. IDC Synergy Research Group
Macroeconomic forces affecting the sector
- Regulation (AI & privacy): The EU AI Act entered into force Aug 1, 2024; prohibitions and AI-literacy duties applied from Feb 2, 2025; GPAI model obligations apply Aug 2, 2025; full applicability Aug 2, 2026 (with some extended timelines). Compliance windows affect model providers and downstream software vendors. Digital Strategy Europe
- Privacy & signal loss (third-party cookies): Chrome’s third-party cookie phase-out plan shifted, introducing a grace period and ongoing adjustments in 2025; advertisers are guided toward Privacy Sandbox alternatives. Translation: more reliance on first-party data and measurement in software GTM. Privacy Sandbox Google Help
- Tech adoption tailwinds: Cloud infrastructure spending was ~$99B in Q2’25 (+~25% YoY), underpinning growth for SaaS, data, and AI platforms riding hyperscaler ecosystems. Synergy Research Group
- Labor & capability mix: Median US software-developer wage hit $133,080 (May 2024); hiring remains AI-skewed with ~125k AI-skills postings (May ’25), while tech unemployment fluctuated around 3–3.5% in 2025—pressure to automate and to prioritize products with clear productivity ROI. Bureau of Labor Statistics CompTIA CIO Dive
Competitive dynamics: consolidation vs. fragmentation
- Cloud platforms are oligopolistic, concentrating power with AWS, Microsoft Azure, and Google Cloud; Q2’25 spending neared $99B with Big-3 dominance—giving these platforms outsized influence on software distribution (marketplaces, co-sell). Synergy Research Group Statista
- Applications remain fragmented across 2,000+ software categories on G2, with tens of thousands of SaaS vendors—evidence of long-tail competition and niche specialization. G2
Consolidation trend (security/tooling): Multiple studies show a strong push to vendor consolidation (e.g., Gartner-cited surveys indicating ~75% of organizations pursued consolidation vs. 29% in 2020). Expect continued platformization in security and ops as buyers cut tool sprawl. Cybersecurity Dive TechUK
Competitive dynamics: consolidation vs. fragmentation
- Cloud platforms are oligopolistic, concentrating power with AWS, Microsoft Azure, and Google Cloud; Q2’25 spending neared $99B with Big-3 dominance—giving these platforms outsized influence on software distribution (marketplaces, co-sell). Synergy Research Group Statista
- Applications remain fragmented across 2,000+ software categories on G2, with tens of thousands of SaaS vendors—evidence of long-tail competition and niche specialization. G2
- Consolidation trend (security/tooling): Multiple studies show a strong push to vendor consolidation (e.g., Gartner-cited surveys indicating ~75% of organizations pursued consolidation vs. 29% in 2020). Expect continued platformization in security and ops as buyers cut tool sprawl. Cybersecurity Dive TechUK
Market map (major players by segment)
| Segment | Major Players | Why they matter | Reference |
|---|---|---|---|
| Cloud Infra / Platforms | AWS, Microsoft Azure, Google Cloud | Run-rate scale & co-sell/marketplaces; AI infra | Synergy Research (Q2’25) |
| CRM | Salesforce, Microsoft, Oracle, Adobe, SAP | Category scale; top of go-to-market stack | IDC CRM Market Share, HG Insights CRM size |
| ERP / Financials | SAP, Oracle, Microsoft, Infor, IFS | Core systems; vertical specializations | IDC MarketScape (IFS), IDC MarketScape (Infor) |
| ITSM / Workflow | ServiceNow, Freshworks, Atlassian | Backbone for ops and GenAI agents | IDC Enterprise Apps |
| Security (EPP, CNAPP, Identity, Backup) | CrowdStrike, Palo Alto Networks, Okta, Veeam | Consolidation to platforms; AI-driven defense | Gartner via ITPro, Gartner backup share |
| Vertical SaaS (examples) | Manufacturing: IFS, Infor • Healthcare: Oracle Health • Public Sector: Tyler Technologies • Fintech/Payroll: ADP, Gusto | Industry workflows; regulatory moats | IDC (IFS) |
What this landscape implies (strictly tied to the outline’s scope)
- Large & expanding TAM anchored by $1.23T software and a $316B+ SaaS SAM—with AI/infra investment and cloud distribution as force multipliers. ITPro Today Fortune Business Insights
- Segment opportunities: Enterprise apps (CRM/ERP/ITSM) remain resilient; security grows with AI/cloud risk; data & AI platforms benefit from software taking the largest share of AI spend. IDC+1 IT Pro
- Macro frictions: Compliance milestones under the EU AI Act and evolving Chrome cookie timelines push vendors toward trust, governance, and first-party data strategies. Digital Strategy Europe Privacy Sandbox
- Competitive structure: Oligopoly at the platform layer (hyperscalers) but fragmentation across 2,000+ app categories, with ongoing vendor consolidation cycles in security and ops to counter tool sprawl. Synergy Research Group G2 Cybersecurity Dive
M&A Trends and Deal Activity — Information Tech & Software (last 12–24 months)
Notable acquisitions & where multiples are landing
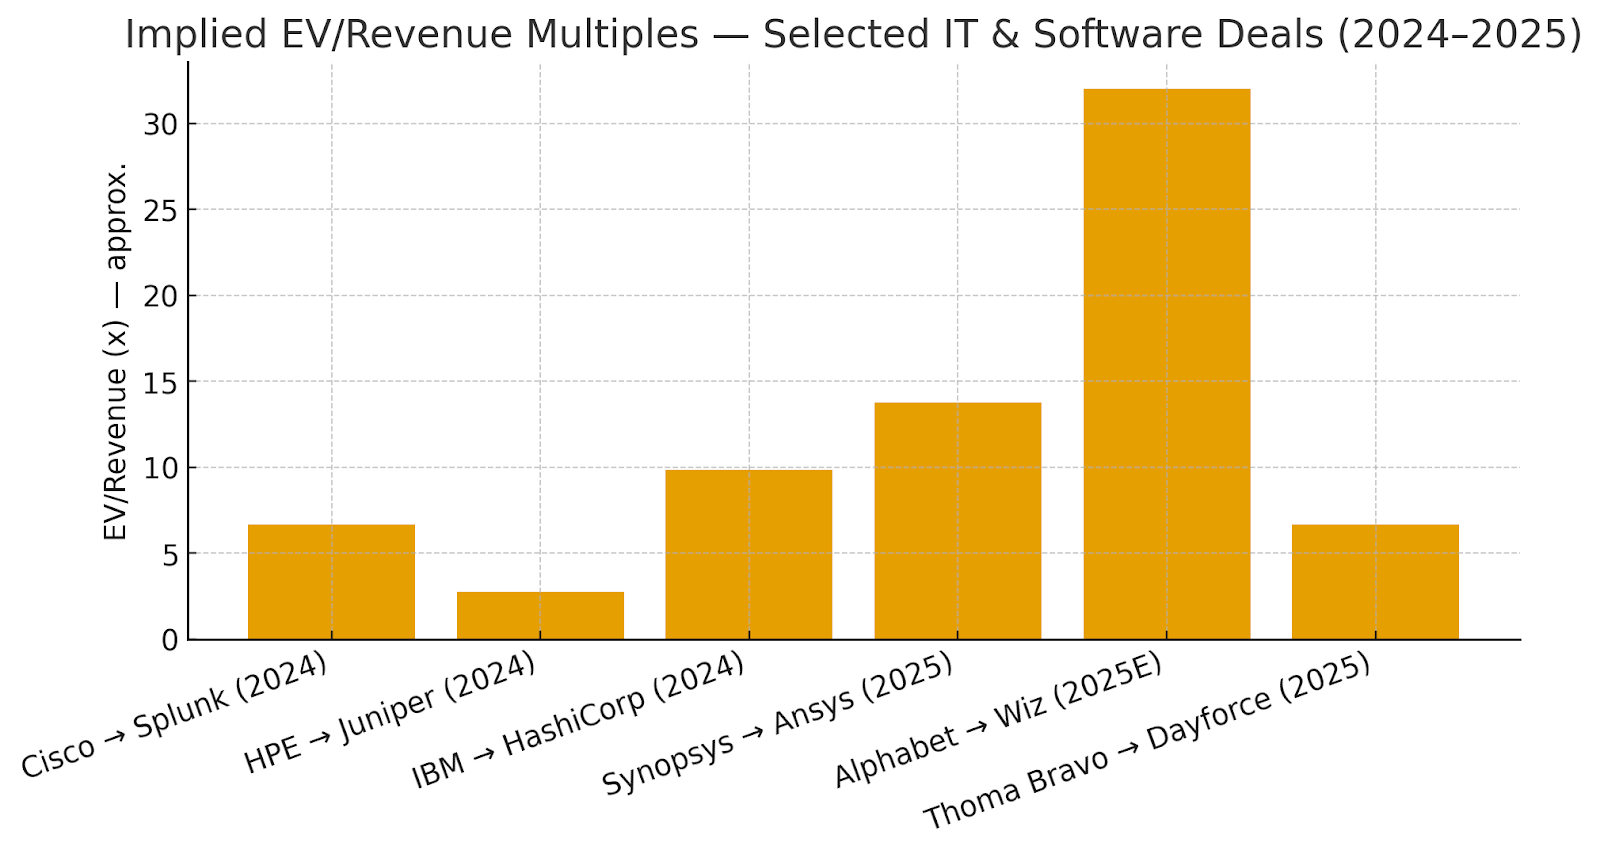
Big-cap strategics and large-cap PE have been active across infrastructure software, cybersecurity, design/simulation, networking and HCM. Recent headline deals (values are transaction value; multiples are approximate EV/Revenue using latest reported or stated run-rate figures):
- Alphabet → Wiz (cybersecurity) — ~$32B; ~32.0x EV/Rev (2025E $1B). Alphabet’s largest-ever deal, aimed at hardening Google Cloud security; antitrust review ongoing. Reuters+2
- Thoma Bravo → Dayforce (HCM) — $12.3B; ~6.6x EV/Rev (TTM ~$1.85B); take-private to accelerate AI and margin expansion. Reuters Companies Market Cap
- Synopsys → Ansys (engineering simulation) — $35B; ~13.8x EV/Rev (FY2024 ~$2.545B); closed July 17, 2025. investor.synopsys.com Yahoo Finance
- IBM → HashiCorp (infrastructure automation) — $6.4B; ~9.8x EV/Rev (TTM ~$0.65B). Reuters Companies Market Cap
- HPE → Juniper Networks (networking) — $14B; ~2.8x EV/Rev (FY2024 ~$5.07B); DOJ settlement cleared path to close. Reuters+1 Macrotrends
- Cisco → Splunk (security/observability) — $28B; ~6.6x EV/Rev (FY2024 ~$4.216B); completed 2024. Reuters Splunk
What it means: top-tier security and simulation assets still command double-digit revenue multiples; large “classic” infrastructure/software platforms (HCM, observability) are transacting ~6–7x; mature hardware-adjacent software/services (networking) are lower-multiple despite strategic rationale.
Private equity & strategic buyer activity levels
- Volumes down, values up. In H1’25, technology deal volumes fell ~11% YoY while values rose ~15%, reflecting fewer but larger AI-themed transactions. PwC
- AI/software dominates tech M&A. Reuters reports AI software deals account for ~75% of tech M&A so far in 2025, with legacy vendors buying data infrastructure to stay competitive. Reuters
- PE still selective but active on take-privates. Fundraising headwinds (global PE fundraising to June 2025 at its lowest in ~7 years, per Preqin data reported by the FT) are tempering aggression, yet sponsors with domain playbooks (e.g., Thoma Bravo) continue to pursue software carve-outs and take-privates. Financial Times
- Corporate strategics leaning into megadeals to extend product maps into AI/data/security (e.g., Synopsys/Ansys; Alphabet/Wiz; Cisco/Splunk; HPE/Juniper). Reuters+3
Valuation benchmarks — revenue & EBITDA multiples (with company-size context)
Public software multiples (reference points):
- Cloud software (BVP Nasdaq Emerging Cloud Index): Avg EV/Revenue ~8.7x; avg revenue growth ~20%. The BVP Nasdaq Emerging Cloud Index
- US Software (System & Application): Avg EV/EBITDA ~28.0x (positive-EBITDA firms; Jan 2025). Computer Services: ~14.3x. Stern School of Business
Private software multiples (reference points):
- Private SaaS (SaaS Capital Index): Median ~7.0x current run-rate revenue; bootstrapped predicted ~4.8x, equity-backed ~5.3x. SaaS Capital+1
- Private tech M&A (size-sensitive): B2B SaaS revenue multiples typically ~2.3–3.2x (revenue $1M–$75M) and EBITDA multiples ~9.0–12.4x (EBITDA $1–10M) in H1’25 deal data. First Page Sage
Valuation Benchmarks (Public vs. Private)
| Segment / Source | Metric | Size Band (if any) | Benchmark | As of | Reference |
|---|---|---|---|---|---|
| Public Cloud Software (BVP Cloud Index) | EV/Revenue (avg) | Index constituents | ~8.7x | 2025 YTD | BVP Cloud Index |
| US Software – System & Application | EV/EBITDA (avg) | Positive-EBITDA firms | ~28.0x | Jan 2025 | Damodaran (NYU) |
| US Computer Services | EV/EBITDA (avg) | Positive-EBITDA firms | ~14.3x | Jan 2025 | Damodaran (NYU) |
| Private SaaS (SCI median) | Revenue multiple (ARR) | All sizes | ~7.0x | Jan 2025 | SaaS Capital |
| Private SaaS (bootstrapped vs. equity-backed) | Revenue multiple (predicted) | All sizes | ~4.8x vs. ~5.3x | Aug 2025 | SaaS Capital |
| Private B2B SaaS (H1’25 deal comps) | EV/Revenue (by revenue band) | $1–5M / $6–10M / $10–75M | ~2.3x / 3.1x / 3.2x | H1 2025 | First Page Sage |
| Private B2B SaaS (H1’25 deal comps) | EV/EBITDA (by EBITDA band) | $1–3M / $3–5M / $5–10M | ~9.0x / 11.0x / 12.4x | H1 2025 | First Page Sage |
Public vs. private comparables — what the gap implies
- Public cloud software averages ~8–9x EV/Revenue (faster growers can trade well above; slower/more mature trade below). Private upper-midmarket SaaS often clears ~3x EV/Revenue unless growth/retention is exceptional (SCI median ~7x is run-rate ARR and skews to higher-quality sets). This public–private spread underpins the current take-private wave for quality but de-rated names (e.g., Dayforce), while still leaving room for premium outliers (e.g., Wiz) where strategic synergy and category leadership justify higher prices. The BVP Nasdaq Emerging Cloud Index
Recent Deal Comps (with sources)
| Date | Acquirer → Target | Segment | Deal Value (US$B) | Ref. Revenue & Period | Implied EV/Rev | Sources |
|---|---|---|---|---|---|---|
| Mar 18, 2025 (ann.) | Alphabet → Wiz | Cybersecurity | 32.0 | ~$1.0B (2025E) | ~32.0x | Reuters, Reuters (rev. context) |
| Aug 21, 2025 (ann.) | Thoma Bravo → Dayforce | HCM / Enterprise SaaS | 12.3 | ~$1.85B (TTM) | ~6.6x | Reuters, CompaniesMarketCap |
| Jul 17, 2025 (closed) | Synopsys → Ansys | Engineering Simulation | 35.0 | ~$2.545B (FY2024) | ~13.8x | Synopsys IR, Yahoo Finance (rev.) |
| Apr 24, 2024 (ann.) | IBM → HashiCorp | Infra Automation | 6.4 | ~$0.65B (TTM) | ~9.8x | Reuters, CompaniesMarketCap |
| Jan 9, 2024 (ann.) / 2025 cleared | HPE → Juniper Networks | Networking / AI-Native | 14.0 | ~$5.07B (FY2024) | ~2.8x | Reuters, Reuters (DOJ), Macrotrends (rev.) |
| Sep 21, 2023 (ann.) / Mar 2024 (EU cleared) | Cisco → Splunk | Security / Observability | 28.0 | $4.216B (FY2024) | ~6.6x | Reuters, Splunk IR (rev.) |
Method note: Multiples above are directional and derived by dividing announced transaction value (equity value or EV as reported) by the latest reported or stated revenue/run-rate available at announcement; differences in treatment of cash/debt and period alignment can move the implied multiple.
Analyst takeaways (for HOLD.co)
- AI/security & simulation continue to price at premiums. Category leaders with strong NRR and mission-critical positioning (Wiz, Ansys) clear double-digit revenue multiples; strategic acquirers are willing to pay up for capability gaps tied to AI workloads and cloud security. Reuters+1
- Take-privates are back where the public–private spread is widest. Public software deratings vs. private ARR benchmarks (SCI ~7x) + rate-sensitive investors have created room for PE value creation (Dayforce, Verint). The BVP Nasdaq Emerging Cloud Index SaaS Capital Reuters
- Expect fewer, larger deals near term. With volumes down but values up and AI driving 2025 tech M&A mix, sourcing will skew to scaled assets and carve-outs rather than many sub-scale tuck-ins. PwC Reuters
Technology & Innovation Trends — Information Tech & Software (2025)
State of digitization & software adoption
- Cloud is the default compute model. Q2’25 enterprise spend on cloud infrastructure services hit ~$99B (+25% YoY); growth has re-accelerated from 2023 as AI workloads scale. Synergy Research Group CRN Statista
- Workloads continue migrating to public cloud, with Flexera reporting “over half” of enterprise/SMB workloads now in public clouds; only ~21% of cloud workloads have been repatriated. Hybrid is the norm, with ~70% of orgs using hybrid/multi-cloud and 2.4 public providers on average. info.flexera.com SoftwareOne
- AI adoption is broad but uneven. Gartner expects global GenAI spending to reach ~$644B in 2025, while developer-level usage is already high (~75%+ regularly use AI tools). Many firms, however, are still in pilot phases and struggling to show ROI. VentureBeat IT Pro The New Yorker
- Enterprise apps keep expanding. IDC forecasts enterprise applications revenue >$600B by 2028 as AI is embedded in workflows. MonitorDaily
Adoption snapshot & sources
| Metric | 2025 Reading | Notes | Source |
|---|---|---|---|
| Cloud infra services spend (Q2’25) | ~$99B; +24–25% YoY | 3rd straight quarter of 24–25% YoY growth | Synergy Research |
| Workloads in public cloud | >50% | Repatriated workloads ~21% | Flexera 2025 |
| Hybrid / multi-cloud adoption | ~70% | Avg. 2.4 public providers | SoftwareOne recap of Flexera 2025 |
| GenAI spending (2025) | ~$644B | +76% YoY vs 2024 | Gartner (via VentureBeat) |
| Developers regularly using AI | ~75%+ | 80% would miss AI if removed | ITPro (Microsoft study) |
Emerging tech reshaping the stack (AI, IoT/edge, blockchain)
- GenAI & agentic systems are moving from experimentation toward embedded capabilities across apps, data, and workflows; CIOs are budgeting accordingly and often plan to buy app-layer solutions. VentureBeat Andreessen Horowitz Barron's
- Edge/IoT growth: cellular IoT connections are on an ~11% CAGR to 2030 (>7B by 2030), and 90% of surveyed organizations increased edge-AI budgets for 2025—supporting inference at the edge for latency, cost and sovereignty. ericsson.com ZEDEDA
- Blockchain adoption is selective: while CFO intent for treasury crypto use is ~23% within 24 months, production deployments remain targeted; smart-contract/stablecoin use cases are expected to mature within ~2 years per Gartner’s 2024 blockchain/Web3 hype cycle. Deloitte Ledger Insights
“What’s breaking out” quick map
| Trend | Enterprise Signal (2025) | Implication for Product/Routes-to-Market | Reference |
|---|---|---|---|
| GenAI apps & agents | Spend forecast ~$644B; CIOs bias to buy at app layer | Partner/integrate with ISVs; emphasize governance & data control | Gartner; J.P. Morgan CIO survey (Barron’s) |
| Edge AI / IoT | Edge-AI budgets up across 90% of orgs; cellular IoT on 11% CAGR to 2030 | Optimize for on-device/in-plant inference; hardware-aware models | ZEDEDA CIO Survey; Ericsson Mobility Report |
| Blockchain / tokenization | 23% of CFOs expect crypto use in finance within 24 months; stablecoins/smart contracts nearing mainstream | Focus on narrow, regulated, ROI-clear use cases (payments, settlement, tokenized assets) | Deloitte CFO Signals; Gartner (via LedgerInsights) |
R&D spend benchmarks (software)
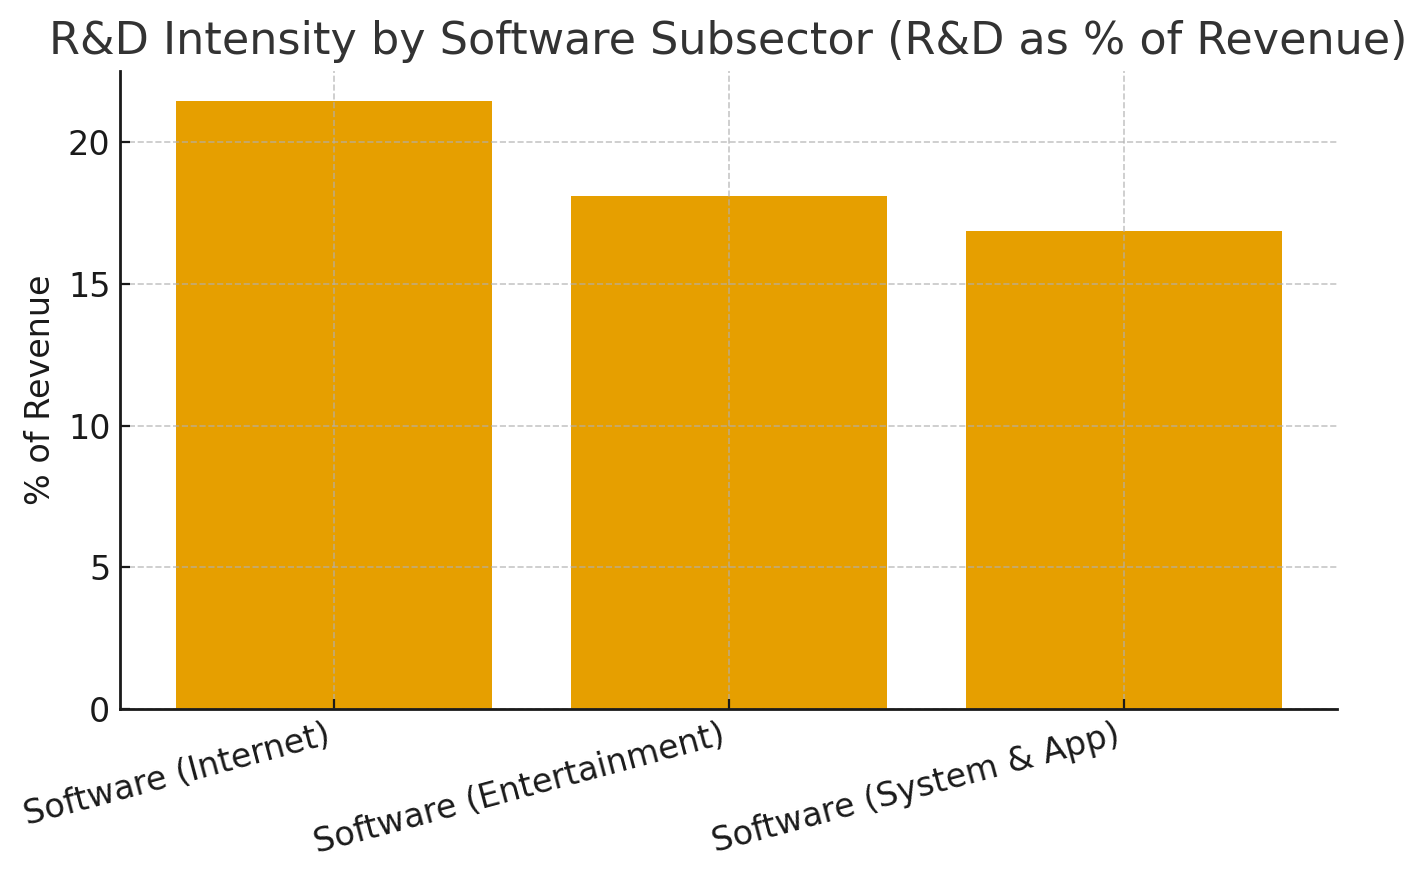
Damodaran’s January 2025 sector cuts show R&D intensity (R&D as % of revenue) around 21.5% for Software (Internet), 18.1% for Software (Entertainment), and 16.9% for Software (System & Application). Use these as guardrails for budgeting product/AI roadmaps and benchmarking peers. Stern School of Business
R&D intensity table (with source)
| Subsector | R&D as % of Revenue (Jan 2025) | Source |
|---|---|---|
| Software (Internet) | ~21.46% | Damodaran sector tables |
| Software (Entertainment) | ~18.10% | Damodaran sector tables |
| Software (System & Application) | ~16.86% | Damodaran sector tables |
Cybersecurity & infrastructure risks (what matters for product & GTM)
- Threat mix is worsening: Verizon’s 2025 DBIR reports ransomware present in ~44% of breaches (37% increase YoY), with edge device/VPN vulnerabilities surging and a median patch time of 32 days; only ~54% fully remediated. Verizon
- Breach costs remain material: IBM’s 2025 Cost of a Data Breach finds a global average of $4.44M, but U.S. average is $10.22M; AI “shadow IT” raises costs and risk. IBM Baker Donelson CyberScoop IT Pro
- Software supply-chain exposure: 2025 OSSRA shows open source remains ubiquitous with persistent high-risk vulnerabilities; Sonatype flagged ~18k new malicious packages in Q1’25 and a ~188% YoY surge in malicious OSS packages. SBOMs/SCA are becoming table stakes. Black Duck Sonatype IT Pro
- Data-center capacity & power constraints: Uptime Institute’s 2025 survey highlights tight power availability, rising densities (10–30 kW racks), and AI-driven costs, creating lead-time and location risks for scaling. Uptime Institute intelligence.uptimeinstitute.com Data Center Knowledge
Risk/mitigation quick reference
| Risk | 2025 Evidence | Mitigation Priorities | Source |
|---|---|---|---|
| Ransomware/system intrusion | Ransomware in ~44% of breaches; edge/VPN vulns ↑; 32-day median fix | Rapid patching for edge, EDR + identity protection, immutable backups | Verizon DBIR 2025 (exec summary) |
| Breach cost & “shadow AI” | Global avg $4.44M; U.S. avg $10.22M; ungoverned AI raises costs | AI usage policies, model access controls, data-loss prevention | IBM 2025 CoDB |
| Open-source supply chain | ~18k new malicious packages in Q1’25; 188% YoY surge | SBOM/SCA in CI, dependency pinning, signed artifacts | Sonatype Q1’25 |
| Power/density constraints | Higher rack densities; grid & cost constraints impacting AI expansion | Location strategy, colocation, energy contracts, efficiency targets | Uptime Institute 2025 |
Build vs. buy opportunities for tech innovation
Enterprise pattern in 2025:
- Buy at the application layer; build the data & orchestration layer. CIO surveys show a preference to purchase AI applications/agents while investing internally in data pipelines, governance, and integration—accelerating time-to-value and reducing model risk. Barron's Andreessen Horowitz
- Platform decisions follow workload gravity. Where latency, cost, or data sovereignty matter (manufacturing, field ops), edge inference and hybrid deployment favor buying optimized platforms or co-developing with vendors; where differentiation is the product logic itself, build to capture IP. ZEDEDA
- Capex & talent trade-offs: IDC sees AI infra spend growing rapidly (accelerated servers >75% of AI infra spend by 2028, ~42% CAGR), pushing many buyers toward managed platforms/SaaS in the near term. IDC
Build vs. Buy decision matrix (with evidence)
| Scenario | Bias | Why (data-backed) | Reference |
|---|---|---|---|
| AI agents for customer support, sales ops, coding copilots | Buy / partner | CIOs plan to primarily buy app-layer agents; faster ROI | J.P. Morgan CIO survey (Barron’s) |
| Data pipelines, feature stores, governance | Build (on managed platforms) | Durable advantage from proprietary data/integration; spend shifting into core data layer | a16z: How CIOs build & buy GenAI (2025) |
| Low-latency edge inference (factory/retail/field) | Buy / co-develop | 90% increased edge-AI budgets; need optimized HW/SW stacks | ZEDEDA CIO Survey 2025 |
| Blockchain in finance/treasury | Pilot with vendors | 23% of CFOs expect crypto usage within 24 months; standards maturing | Deloitte CFO Signals (Q2’25) |
What this means for HOLD.co (strategy implications)
- Prioritize app-layer AI acquisitions/partnerships where buyers show a strong preference to purchase (agents, copilots, observability/security add-ons), while building internal data/ML ops for synergy across portfolio. Barron's Andreessen Horowitz
- Lean into edge-enabled categories (industrial, retail ops, telco, healthcare): budgets are shifting to edge inference and hybrid architectures, creating opportunities for verticalized platforms. ZEDEDA
- Underwrite infra risks explicitly—assess target exposure to supply-chain vulnerabilities, ransomware prevalence, and power/density constraints that can elongate deployments or raise COGS. Verizon
Operations & Supply Chain Landscape — Information Tech & Software
Typical cost structure (COGS, SG&A, labor, logistics)
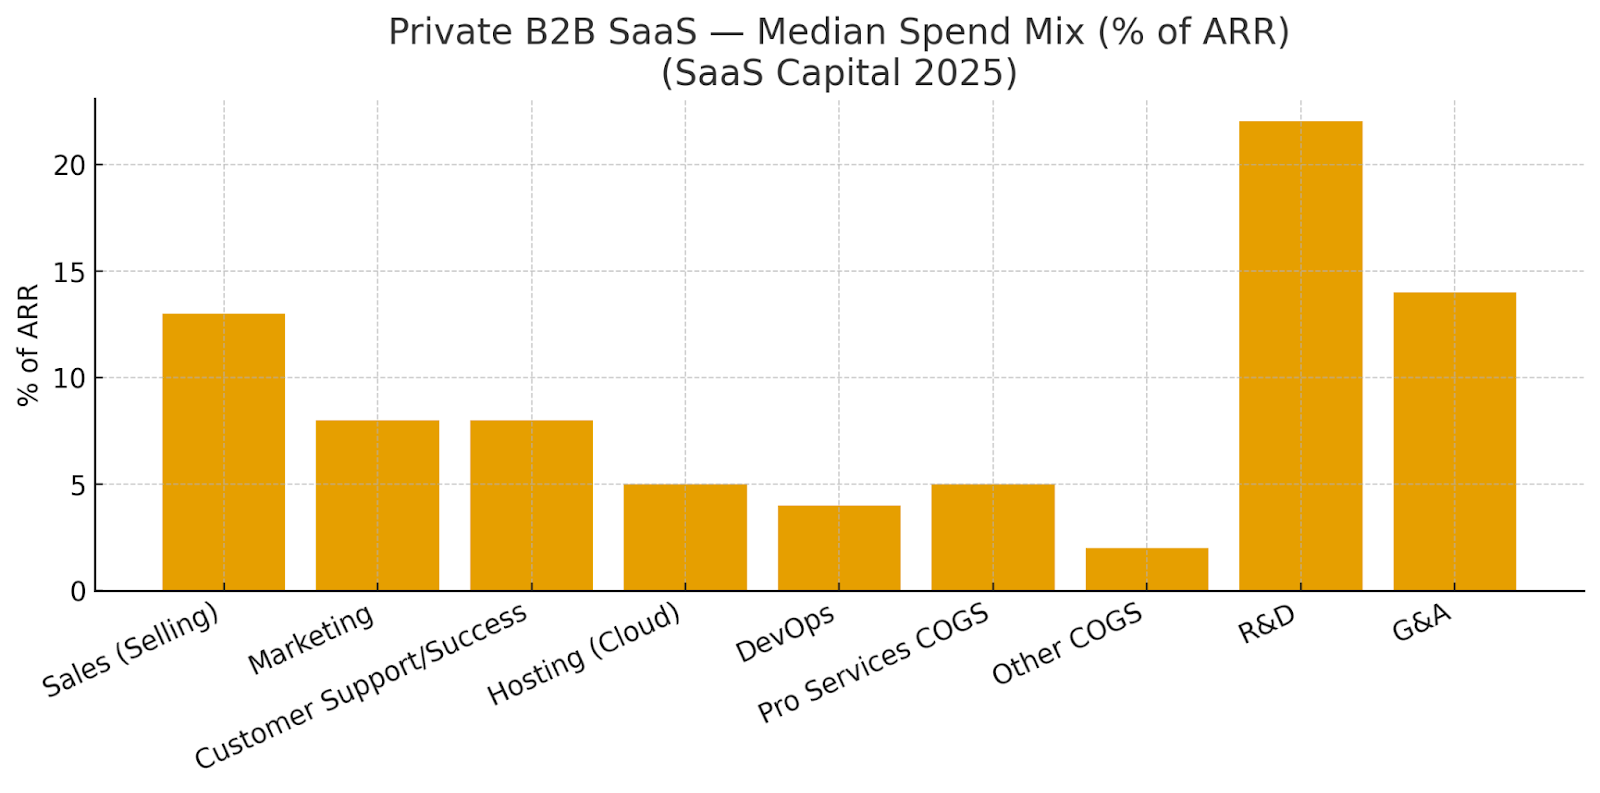
SaaS cost mix (private B2B median): recent cross-section benchmarks show median spend of Sales 13%, Marketing 8%, Customer Support/Success 8%, Hosting (cloud) 5%, DevOps 4%, Pro services COGS 5%, Other COGS 2%, R&D 22%, G&A 14% of ARR. Bootstrapped firms typically spend ~95% of ARR in total vs ~107% for equity-backed peers (more growth investment). SaaS Capital
Gross margin: subscription GM remains high and stable at ~79% (median) in 2023–24 cohort data. joinpavilion.com
What sits in COGS: cloud hosting/egress, support headcount, DevOps/tooling, payment/billing rails, third-party data/services (classification varies by company). FinOps practices increasingly govern hosting/egress optimization. data.finops.org
Cost structure snapshot (with sources)
| Line Item | Median (Private B2B SaaS) | Notes | Source |
|---|---|---|---|
| Subscription Gross Margin | ~79% | Stable vs. prior year | Pavilion 2024 SaaS Benchmarks |
| Hosting (Cloud) | ~5% of ARR | Unit cost managed via FinOps | SaaS Capital 2025 |
| DevOps | ~4% of ARR | CI/CD, observability, SRE | SaaS Capital 2025 |
| Customer Support/Success | ~8% of ARR | Varies with self-serve vs. enterprise mix | SaaS Capital 2025 |
| Sales & Marketing (combined) | ~21% of ARR | Sales 13%, Marketing 8% | SaaS Capital 2025 |
| R&D | ~22% of ARR | AI/features, platform work | SaaS Capital 2025 |
| G&A | ~14% of ARR | Often higher in equity-backed firms | SaaS Capital 2025 |
Supply chain: strengths & vulnerabilities
Cloud concentration & power: Cloud is now a ~$99B/quarter market growing ~25% YoY, but capacity/power constraints are emerging as a structural risk for scaling AI and hosting workloads. Uptime Institute’s 2025 survey flags worsening power availability and rising densities; about one-third of operators are already running AI training/inference. Regional shares remain concentrated among U.S. hyperscalers (e.g., ~70% share in Europe for AWS, Microsoft, Google), creating supplier dependence and sovereignty considerations. Synergy Research Group Uptime Institute Datacenter Dynamics IT Pro
Egress & vendor lock-in: Egress fees remain a material driver of cloud COGS and multi-cloud friction; efforts like Cloudflare’s Bandwidth Alliance and specific provider programs reduce/waive transfer fees in some routes. FinOps teams’ top challenge continues to be getting engineers to act on optimization, underscoring the operational nature of cost control. Cloudflare finops.org
Compute supply chain: AI build-outs introduce hardware dependencies beyond pure software—HBM memory, advanced packaging (e.g., CoWoS), and GPU server lead times of ~6–12 months are repeatedly cited, with some price relief as supply broadens. sourceability.com Inteleca Uptime Institute Jarvislabs Docs
Software supply chain (OSS): Malicious packages and typosquatting continue to surge—~17,954 new malicious OSS packages in Q1’25 alone—while SBOM adoption remains uneven. Recent NPM incidents (e.g., Nx compromise) illustrate developer-credential theft risk. sonatype.com SD Times DevOps.com TechRadar
Labor force trends (shortages, automation, outsourcing)
- Tight but stable U.S. tech labor: Tech unemployment hovered ~2.8–2.9% mid-2025, below the national rate, indicating ongoing scarcity of experienced engineers. CompTIA
- Wages remain elevated: U.S. median software developer pay = $133,080 (May 2024); web developers/designers near $90–98k median. Bureau of Labor Statistics
- AI skill premium & upskilling: The share of job postings asking for AI skills rose to ~1.8% in 2024 (U.S.); Fed/Lightcast and industry analyses confirm rising employer demand for AI literacy across roles. Our World in Data Federal Reserve Bank of Atlanta
Global pipelines: Reports from India and media coverage point to significant AI talent gaps relative to openings—supporting continued offshoring/nearshoring and internal training. The Times of India
Benchmark data: margins, throughput & cycle times
Delivery performance (DORA/Accelerate): Modern software operators track the four key metrics—Deployment Frequency, Lead Time for Changes, Change Failure Rate, and MTTR—as the basis of throughput and stability. 2024 summaries indicate elite teams deploy multiple times/day, recover in <1 hour, and target 0–5% CFR; high performers typically achieve lead time ≤ 1 day. Use these as operational guardrails when evaluating targets or integration plans. Google Cloud Forte Group multitudes.com CloudBees
FinOps & unit economics: As cloud becomes a dominant COGS driver, optimization, allocation/chargeback, and forecasting are now standard FinOps priorities; Deloitte estimates up to $21B in savings in 2025 from FinOps adoption. data.finops.org+1Deloitte
Operations benchmarks (with sources)
| Metric | 2025 Benchmark / Guardrail | Where it shows up (P&L / Ops) | Source |
|---|---|---|---|
| Subscription Gross Margin | ~79% median | Gross profit | Pavilion 2024 |
| Hosting (cloud) as % ARR | ~5% (median) | COGS | SaaS Capital 2025 |
| DevOps as % ARR | ~4% (median) | COGS / OpEx | SaaS Capital 2025 |
| Deployment frequency | Elite: multiple/day | Throughput | Forte Group on DORA 2024 |
| Lead time for changes | High: ≤ 1 day; Elite: < 1 hour | Cycle time | CloudBees (DORA thresholds) |
| Change failure rate | Elite: ~0–5% | Quality | Multitudes (2024 DORA) |
| MTTR | Elite: < 1 hour | Resilience | Forte Group on DORA 2024 |
Supply chain/ops value chain (where costs & risks accrue)
| Stage | Primary Activities | Key Cost Drivers | Operational KPIs | Concentration/Risk | Evidence |
|---|---|---|---|---|---|
| Plan & Build (Eng/Prod) | Backlog, coding, reviews, CI | R&D headcount/tools (~22% ARR) | DORA metrics (DF, LTC, CFR, MTTR) | Talent scarcity; wage inflation | SaaS Capital; DORA 2024; BLS |
| Package & Secure | Dependencies, SBOM, SCA | AppSec tooling; developer time | Vuln backlog SLA | Malicious OSS packages; repo attacks | Sonatype Q1’25; SBOM adoption |
| Run (Cloud/DC) | Deploy, scale, observe | Hosting/egress (~5% ARR); SRE | Uptime; cost per request/user | Power constraints; provider lock-in | Synergy Research; Uptime 2025; Bandwidth Alliance |
| AI/Compute Supply | GPU/HBM procurement | Capex; lead times (6–12 mo.) | Capacity delivered on-time | HBM & packaging bottlenecks | HBM lead times; GPU server lead times |
| Support/Billing/CS | Ticketing, success, collections | CS headcount (~8% ARR) | Time to resolution; NPS/NRR | 3rd-party processors; churn risk | SaaS Capital 2025 |
What this means for HOLD.co (ops levers to underwrite)
- Model COGS explicitly: For software-heavy targets, underwrite hosting (≈5% ARR median) + DevOps (≈4%) and test sensitivity to egress/AI inference costs; include FinOps maturity as part of diligence. SaaS Capital data.finops.org
- Diversify supplier risk: Where feasible, leverage egress-reducing peering (Bandwidth Alliance), multi-region strategies, and power-aware placement—especially for AI-adjacent assets exposed to data-center power constraints. Cloudflare Uptime Institute
- Harden the software supply chain: Require SBOMs and repository firewalls; verify SCA coverage and incident response against the demonstrated volume of malicious OSS packages. sonatype.com
- Operator scorecard: Track DORA metrics and unit cost KPIs (cost per active user/GB/query) alongside GM, NRR; link FinOps accountability to engineering to close the “action gap.” Google Cloud finops.org
Regulatory & Legal Environment (IT & Software)
Key compliance considerations (by footprint & go-to-market)
Global privacy & data use. GDPR remains the global baseline—strict purpose limitation, data minimization, DPIAs, DPOs where required—and enforcement continues to accelerate, with cumulative fines now exceeding ~€6.22B by June 2025 (see chart below). cms.law enforcementtracker.com
AI governance. The EU AI Act entered into force 1 Aug 2024 and phases in through 2025–2027. Prohibitions and AI literacy obligations have applied since 2 Feb 2025; GPAI model duties began 2 Aug 2025; high-risk AI embedded in regulated products has an extended transition to 2 Aug 2027. Expect conformity assessments, technical documentation, post-market monitoring, and incident reporting requirements to affect model release and marketing claims. Digital Strategy
Software & product security. The EU Cyber Resilience Act (CRA) (in force 10 Dec 2024) imposes secure-by-design and vulnerability handling for products with digital elements, with most obligations applying 11 Dec 2027 (SBOM-like evidence, coordinated disclosure, CE-marking). Digital Strategy
US incident disclosure. The SEC’s 2023 cyber rule requires public companies to file Form 8-K Item 1.05 within four business days of determining materiality, plus annual risk-management and governance disclosures. Staff guidance clarifies non-material incidents should use other 8-K items (e.g., 8.01), not 1.05. SEC
Sectoral obligations.
• HIPAA: software vendors that handle PHI are Business Associates—directly liable under HIPAA and must sign BAAs. HHS.gov The HIPAA Journal
• Medical software (SaMD): FDA’s final Cybersecurity in Medical Devices premarket guidance (updated Jun 26, 2025) and earlier 2023 guidance specify secure design and documentation; EU MDR Rule 11 generally elevates SaMD classifications. U.S. Food and Drug Administration Public Health
• Payments: PCI DSS v4.0 is active; fifty-one “future-dated” controls became mandatory 31 Mar 2025 (e.g., targeted risk analyses, multi-factor auth expansion). PCI Security Standards Council
Advertising & claims. The FTC is actively policing deceptive AI marketing—there’s “no AI exemption” from consumer protection law—and warns against quietly rewriting privacy terms to grab training data. Align promotion, documentation, and product behavior. Federal Trade Commission
Platform rules (EU). The Digital Services Act requires transparency reporting (fully in force 17 Feb 2024; first full-scope reports due in 2025) and the Digital Markets Act imposes “gatekeeper” obligations (anti-steering, sideloading/interoperability). 2025 saw the first non-compliance decisions and fines, shaping app distribution economics for software vendors. Digital Strategy IAPP Digital Markets Act (DMA) European Commission
Data portability & cloud switching. The EU Data Act becomes applicable 12 Sep 2025—major implications for connected-product data access, B2B data sharing, and cloud switching/egress terms. Digital Strategy
Export controls (developers & cloud). US BIS continues tightening advanced computing and AI export rules (with shifts in early 2025), and encryption remains under the EAR (15 CFR § 742.15). Engineering orgs and CSPs should maintain classification and screening processes. Bureau of Industry and Security Federal Register
Core Compliance Landscape (with links)
| Regulation / Framework | Scope & Who’s in Scope | Key 2025–2027 Dates | What It Means for IT & Software | Source |
|---|---|---|---|---|
| EU AI Act | AI providers, deployers; GPAI & high-risk systems | Prohibitions & AI literacy: 2 Feb 2025; GPAI duties: 2 Aug 2025; High-risk (embedded): 2 Aug 2027 | Model documentation, risk management, transparency; conformity assessments drive release gating | European Commission |
| EU Cyber Resilience Act | Products with digital elements (HW/SW) | In force: 10 Dec 2024; main obligations apply 11 Dec 2027 | Secure-by-design, vulnerability handling, CE-marking; lifecycle cyber compliance | European Commission |
| SEC Cyber Disclosure Rule | US public companies | Effective Dec 2023; 8-K Item 1.05 within 4 business days of materiality | Incident materiality triage; governance disclosures; investor scrutiny | SEC C&DI |
| GDPR | Controllers/processors handling EU personal data | Ongoing; cumulative fines ~€6.22B by Jun 2025 | DPIAs, DPOs, data minimization; growing penalty severity | CMS Enforcement Tracker |
| HIPAA | Covered entities & Business Associates (incl. cloud/SaaS handling PHI) | Ongoing; direct BA liability + BAA requirements | Contracting + safeguards for PHI; audit/readiness obligations | HHS |
| PCI DSS v4.0 | Entities processing, storing, or transmitting cardholder data | Future-dated controls mandatory 31 Mar 2025 | MFA expansion, targeted risk analyses; control redesigns | PCI SSC |
| DSA & DMA (EU) | Platforms & gatekeepers | DSA fully in force 17 Feb 2024 (reports 2025); DMA enforcement actions 2025 | Transparency reports; anti-steering & alternative distribution reshape app economics | EC on DSA | EC on DMA |
| EU Data Act | Connected product makers, data holders; cloud providers | Applicable 12 Sep 2025 | User access to device/service data; cloud switching; FRAND-style B2B terms | European Commission |
Licensing, certification, or authorization hurdles (by segment)
- Public sector & Regulated buyers: FedRAMP authorization (Moderate/High, Rev. 5) is the entry ticket for US federal—reuse via the Marketplace; DoD equivalency efforts continue. SOC 2 (AICPA Trust Services Criteria) and ISO/IEC 27001:2022 (with 2024 climate-action amendment) are common enterprise prerequisites in RFPs and for partner marketplaces. FedRAMP FedRAMP Marketplace AICPA & CIMA ISO
- Healthcare (SaMD/EHR/PHI): FDA premarket cyber guidance and EU MDR Rule 11 upgrade many health apps to class IIa/IIb/III; teams must align SDLC and evidence (IEC 62304) and maintain postmarket vigilance. U.S. Food and Drug Administration Public Health
- Payments/Fintech: PCI DSS v4.0 future-dated controls are now in scope (since 31 Mar 2025). PCI Security Standards Council
- Export controls: Developers shipping binaries/models abroad must evaluate EAR coverage (e.g., encryption under 15 CFR §742.15). Cloud and AI infra teams should track BIS updates on advanced computing and AI model weights. Bureau of Industry and Security Federal Register
Certifications & Authorizations (buyers most often ask for)
| Badge / Standard | Typical Buyer | Focus | Notes | Source |
|---|---|---|---|---|
| FedRAMP (Rev. 5) | US Federal / SLED | Cloud service authorization | Reuse via FedRAMP Marketplace; DoD equivalency & transition in progress | FedRAMP.gov | Marketplace |
| SOC 2 | Enterprise | Security, Availability, PI, Confidentiality, Privacy | Security (Common Criteria) is mandatory scope element | AICPA |
| ISO/IEC 27001:2022 (+ Amd 1:2024) | Global Enterprise | ISMS requirements | 2024 amendment introduces climate-action changes | ISO 27001 | Amendment 1:2024 |
| PCI DSS v4.0 | Merchants/PSPs | Cardholder data protection | Future-dated controls mandatory from 31 Mar 2025 | PCI SSC |
| HIPAA + BAA | Providers/Payers | PHI protection | BAAs required; Business Associates directly liable | HHS |
ESG & sustainability pressures
- EU CSRD: First wave (NFRD companies) began reporting in 2025 on FY 2024; Parliament voted 3 Apr 2025 to delay later waves by two years—non-NFRD issuers get more runway but should keep preparing. PwC Skadden
- Data-center efficiency: Revised EU Energy Efficiency Directive mandates annual disclosure of data-center KPIs to an EU database (Delegated Reg. 2024/1364), with recurring reporting each May. Energy
- CSDDD (due-diligence): In force 25 Jul 2024; Member State transposition underway through 2026-27—expect supply-chain human-rights and environmental governance to enter software procurement. European Commission Latham & Watkins
- US climate disclosure: SEC climate rule adoption (Mar 2024) is stayed pending court review; firms continue scenario analysis and voluntary reporting. Reuters
Pending legislation & watch-list (material marketing/ops impact)
- EU Data Act (applicable 12 Sep 2025): device/service data access rights; B2B sharing; cloud switching—affects product roadmaps and messaging promises. Digital Strategy
- Revised EU Product Liability Directive: expands “product” to include software and AI; Member States must transpose by 9 Dec 2026—post-sale software updates and ML changes can trigger liability. ICLG Business Reports
- US federal privacy (APRA): introduced but not enacted; would preempt many state laws—track for harmonization potential. Meanwhile, state patchwork expands (e.g., MN, MD, NH, NE effective 2024–2025). Congress.gov IAPP
- California Delete Act: CPPA to launch a one-stop deletion mechanism by 1 Jan 2026; data brokers must retrieve and honor requests every 45 days starting 1 Aug 2026—affects data partnerships, enrichment vendors, and retargeting pools. California Privacy Protection Agency
- Export controls (AI chips/model weights): BIS rules updated Jan–May 2025 with revisions & rescissions in flux—maintain export screening for dev, hosting, and model access. Bureau of Industry and Security
ESG & Sustainability Obligations Relevant to Software
| Rule | Who’s Affected | Obligation | Timing | Source |
|---|---|---|---|---|
| EU CSRD | Large & listed cos. in EU; many non-EU with EU presence | Audited sustainability reporting (ESRS) | Wave 1 reporting in 2025 (FY2024); later waves delayed by 2 years (Apr 2025 vote) | PwC | Skadden |
| EU Energy Efficiency Directive | EU data centers ≥500 kW IT load | Annual KPI reporting (energy, water, heat reuse) | Delegated Reg. 2024/1364; annual submissions each May | EC Energy | EC News |
| CSDDD | Large EU & non-EU operating in EU | Supply-chain human rights/environmental due diligence | Entered into force 25 Jul 2024; transposition through 2026–27 | European Commission |
GDPR enforcement momentum (context for privacy risk)
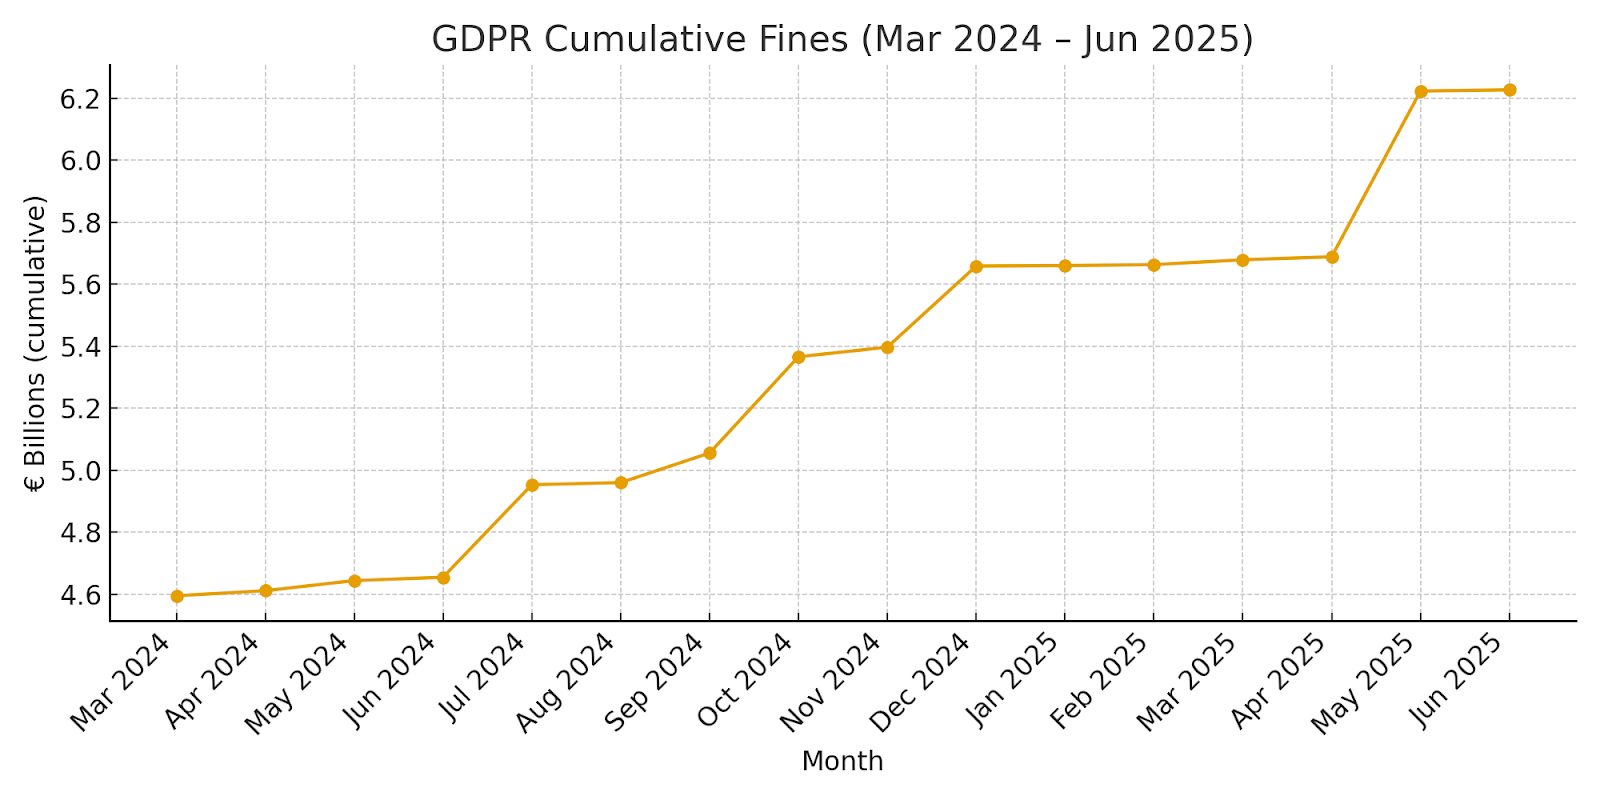
(Cumulative GDPR fines grew from ~€4.59B in Mar 2024 to ~€6.23B in Jun 2025, underscoring rising enforcement risk—source: CMS Enforcement Tracker.) enforcementtracker.com
Practical implications for HOLD.co portfolio marketing ops
- Claims discipline: Synchronize all AI-related messaging and sales materials with model documentation and intended use to avoid FTC-style “AI washing” and EU AI Act transparency breaches. Federal Trade Commission
- Gatekeeper channels: For EU user acquisition, factor DMA anti-steering and alternative distribution into CAC modeling; track Apple/Meta compliance changes by app category. European Commission
- Privacy posture as brand: Treat GDPR/CCPA controls (consent, data minimization, DSAR speed) as go-to-market features; the SEC cyber rule elevates incident readiness and disclosure precision in investor-facing materials. SEC
- Readiness roadmap: Prioritize PCI v4.0 gaps (if payments-adjacent), FedRAMP/SOC2/ISO for enterprise and public sector, and plan for Data Act portability/cloud switching in product and customer success workflows. blog.pcisecuritystandards.org FedRAMP AICPA & CIMA ISO Digital Strategy
Marketing & Demand Generation (Information Tech & Software)
Customer acquisition channels: what’s working now (organic, paid, referral, offline)
- Organic (SEO/website/content). Across B2B, the highest ROI channels last year were website, blog & SEO, followed by paid social, per HubSpot’s 2025 State of Marketing. Organic remains the compounding engine for demo requests and assisted conversions in software. HubSpot Blog HubSpot
- Paid (search, social, CTV/online video, retail/commerce media). Budgets are flat but paid media is still the largest single line item (30.6%) in 2025 CMO budgets; digital dominates the media mix, with social and video growing (e.g., 61.3% of US social ad spend goes to social video in 2025). CTV is scaling (US $33.35B in 2025). Chief Marketer Campaign Live EMARKETER Insider Intelligence
- Referral & review-driven demand. In software, review sites and peer proof now rival (and, for enterprise buyers, often beat) classic search in discovery. G2’s 2025 survey (n=1,169 B2B decision makers) shows review sites’ rising influence and a material share of buyers beginning with AI search. TrustRadius reports buyers increasingly consult LLMs/AI Overviews and rely on verified reviews to build trust. images.g2crowd.com G2 Learning Hub SaaStr TrustRadius Solutions
- Offline (events, field, sponsorships). Despite digital dominance, events lead offline allocations (≈19.3% of nondigital spend) as CMOs re-weight toward mid- and bottom-funnel opportunities in 2025. Chief Marketer
- Cloud marketplaces & co-sell (AWS/Azure/GCP) are emerging demand capture channels: 62% of companies report net-new revenue via cloud marketplaces; AWS expanded co-sell benefits to more ISVs in 2025. Clazar AWS Insider Amazon Web Services
Channel snapshot with sources
| Channel | Primary IT/Software Use | Recent Benchmark / Signal | Strategic Note | Reference |
|---|---|---|---|---|
| Organic (SEO/Website/Blog) | Demand creation & capture; demo requests | Top ROI channel for B2B in 2024 | Compound returns; invest in technical SEO, documentation, and thought leadership | HubSpot |
| Paid Social / Video | Mid-funnel education; retargeting; category POV | 61.3% of US social ad spend goes to social video (2025) | Short-form product storytelling + proof; creative iteration speed matters | Insider Intelligence / eMarketer |
| Paid Search | High-intent capture; competitive displacement | Digital share of budgets remains dominant; paid media largest budget line | Protect brand terms; expand to feature-led and competitor queries | Campaign (Gartner CMO) |
| Review Platforms (G2, TrustRadius) | Peer validation; shortlist influence | Buyers increasingly start with AI search & review sites | Programmatic review generation; profile optimization; comparison pages | G2 2025 | TrustRadius 2025 |
| Events / Field / Sponsorships | Pipeline acceleration; enterprise access | Largest offline allocation (≈19.3%) | Focus on ABM meetings, post-event SDR follow-ups & content re-use | Chief Marketer (Gartner CMO) |
| Cloud Marketplaces (AWS/Azure/GCP) | Procurement shortcut; co-sell leverage | 62% report net-new revenue via marketplaces | List transactable SKUs; attach to cloud commits; co-sell motions | Clazar 2025 | AWS |
Sales funnel structures (DTC/PLG, B2B, enterprise, hybrid)
- DTC/PLG (product-led, self-serve). Buyers increasingly self-serve—Forrester predicts >50% of large B2B ($1M+) transactions will process via digital self-serve channels. Align top-of-funnel education with in-product trials, usage-based packaging, and pay-as-you-go. Forrester investor.forrester.com
- B2B mid-market (marketing + inside sales). Gartner’s non-linear “buying jobs” model (problem ID → solution exploration → requirements → supplier selection) implies content & enablement must map to re-loops rather than a rigid funnel. SDRs should be staged around buying jobs, not MQL dates. Gartner+1
- Enterprise sales (field + ABM). Hybrid interactions (digital, remote, in-person) are now the norm; 71% of sellers offer e-commerce and it accounts for ~34% of revenue in McKinsey’s B2B Pulse. Enterprise pages should support security, architecture, ROI calculators, and marketplace procurement. McKinsey & Company
- Hybrid via marketplaces & partners. Use marketplace listings to shorten procurement while running account-based co-sell with the cloud providers—now a proven net-new source, not just a PO pathway. Clazar
CAC/LTV ratios & brand equity benchmarks
- CAC payback. “Good” payback varies by ACV and motion; 2024–2025 benchmarks range ~12–30 months (early-stage PLG closer to ~12–18; broader SaaS averages 20–30 months). First Page Sage Bantrr
- LTV:CAC. Enduring guidance for healthy SaaS remains ≥3:1 (with context by segment and churn). For Entrepreneurs+1
- Retention as brand proxy. Best-in-class NRR is ~110–120%; bootstrapped private SaaS median NRR ~104% in 2025. Strong brands convert to durable NRR and lower blended CAC. ChartMogul+1 SaaS Capital
Unit economics quick reference
| Metric | Benchmark Range | Notes | Reference |
|---|---|---|---|
| CAC Payback | ~12–30 months | Lower for SMB/PLG, higher for enterprise; watch gross margin in calculation | FirstPageSage | Bantrr (synthesizes VCs) |
| LTV:CAC | ≥ 3:1 | Context-dependent; use cohort LTV and fully-loaded CAC | David Skok |
| NRR (B2B) | ~100–120% (best-in-class 110–120%) | Expansion revenue and retention drive brand strength & efficiency | ChartMogul | SaaS Capital 2025 |
Competitor marketing budgets & media mix
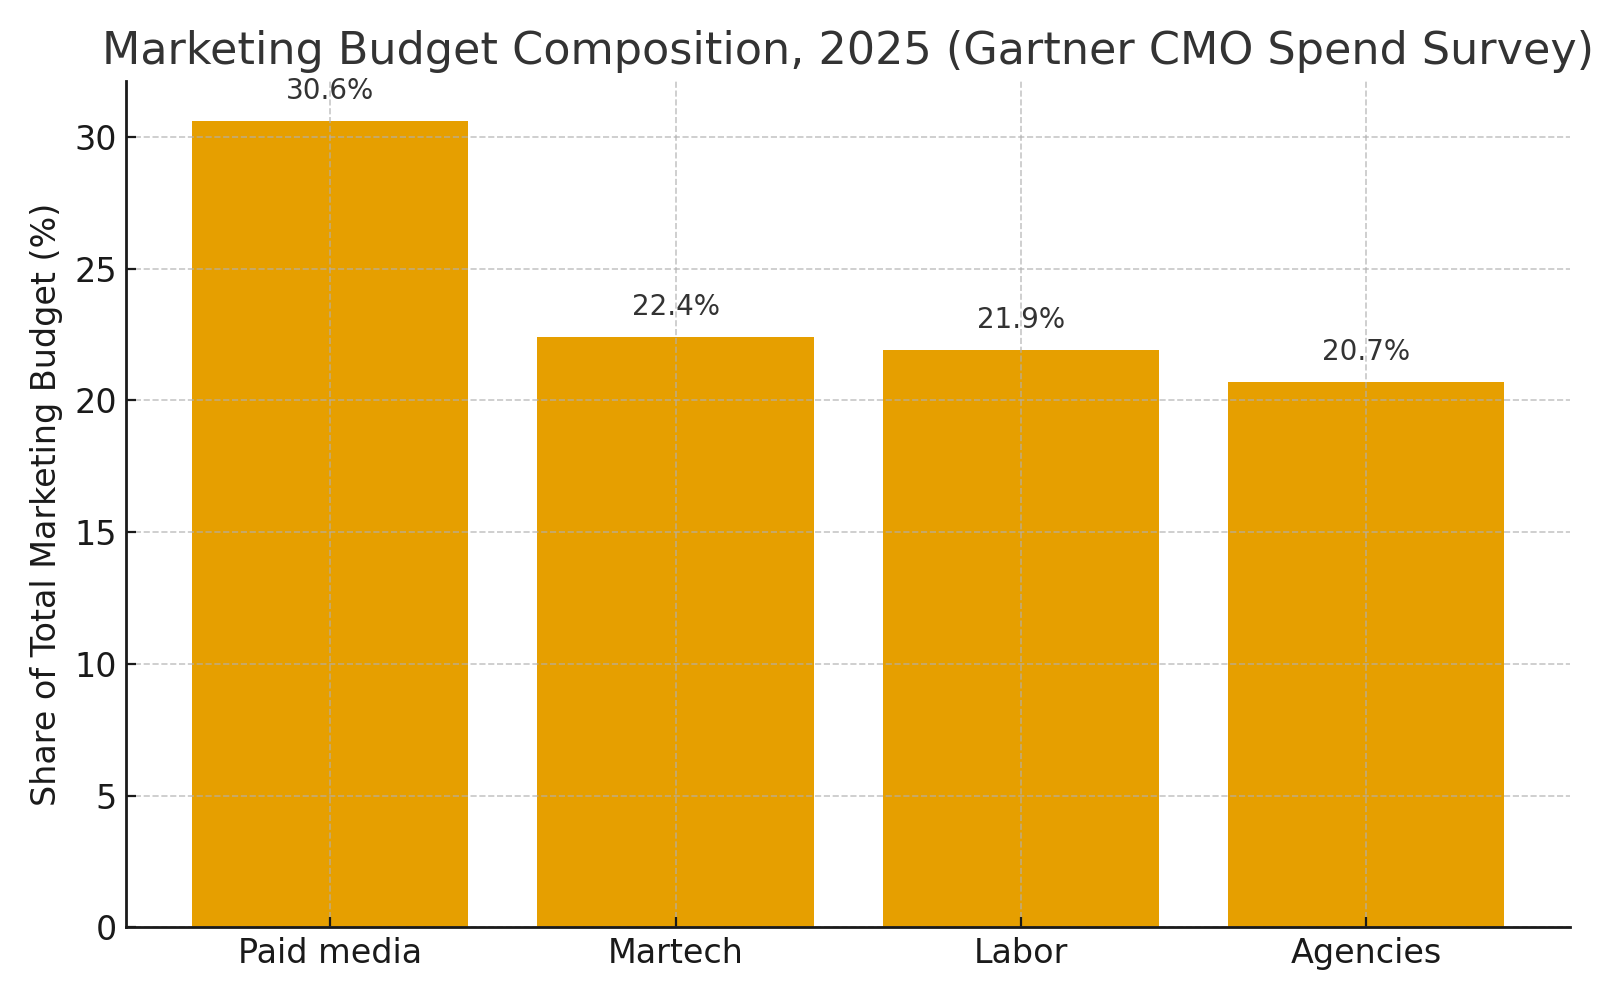
- Total marketing budget levels. Average marketing budgets sit at ~7.7% of company revenue in 2025 (flat YoY). Within budgets, paid media ≈30.6%, with martech (22.4%), labor (21.9%), agencies (20.7%) following. Campaign Live Chief Marketer
- Software peer spend context. For public cloud/SaaS, Sales & Marketing (S&M) runs ≈38% of revenue (median) in 2025 snapshots; private B2B SaaS medians show ~8% of ARR on marketing and ~13% on sales. Use these to triangulate competitors’ aggressiveness and CAC profiles. cloudedjudgement.substack.com +1 SaaS Capital
- Media mix direction of travel. Digital continues to gain share globally (digital >75% of worldwide ad spend in 2025), with social video and CTV among the faster-growing placements. EMARKETER+1 cloud.insight.insiderintelligence.com
Budget composition (Gartner 2025 CMO Spend Survey):
Opportunities for centralized/shared marketing ops post-acquisition (HOLD.co)
- Review & reputation engine (G2/TrustRadius) across the portfolio. Centralize review generation, reference management, and profile optimization; buyers are shortlisting from reviews and AI-surfaced answers. Create a shared playbook and incentives. images.g2crowd.com G2 Learning Hub TrustRadius Solutions
- Cloud Marketplace & co-sell desk. Stand up a portfolio marketplace office to list transactable SKUs, manage private offers, align with AWS/Azure/GCP field teams, and harvest co-sell MDF—validated net-new revenue source. Clazar Amazon Web Services, Inc.
- Shared demand engine & martech consolidation. With budgets flat, reallocate to high-yield components (paid media, essential martech) and retire duplicative tools; negotiate portfolio-wide contracts (MAP, CDP, ABM, intent data). Benchmarks show paid media remains the top share line item. Chief Marketer
- Event efficiency hub. Given events dominate nondigital allocations, centralize booth ops, meeting programs, pre/post-event cadences, and content reuse (talk tracks → assets → SEO hubs). Chief Marketer
- Brand-led growth guardrails. Apply the 95–5 rule to ensure steady, out-of-market reach while demand-capture teams optimize intent; portfolio-level creative studio + measurement framework (share of search, branded queries, direct traffic). LinkedIn Business Solutions WARC
- Budget & efficiency governance. Use peer benchmarks (marketing ~7.7% of revenue; S&M ~38% public median; private medians marketing 8% / sales 13%) to set portfolio guardrails for CAC payback, LTV:CAC, and NRR. Campaign Live cloudedjudgement.substack.com SaaS Capital
Practical benchmarks & guidance for IT/Software campaigns
- Pipeline mix (target): Organic/owned ≥40% of opps; review/marketplace-assisted ≥15–25% in enterprise segments; offline (events/field) ~10–20% with high SQL conversion. (Adjust by ACV and cycle length; enforce multi-touch attribution.) [Grounded in channel ROI & budget direction.] HubSpot Blog images.g2crowd.com Chief Marketer
- Efficiency gates: New-logo CAC payback ≤ 18–24 months (enterprise) / ≤12–18 months (SMB/PLG). Portfolio hurdle LTV:CAC ≥ 3:1; flag any segment <2.5:1. First Page Sage Bantrr For Entrepreneurs
Brand & retention: Aim for NRR ≥ 105% (mid-market) and 110%+ (enterprise/expansion-heavy) to balance flat budgets with durable growth. SaaS Capital ChartMogul
Media & budget benchmarks (with links)
| Benchmark | Latest Figure | What It Implies | Source |
|---|---|---|---|
| Marketing budget as % of revenue (all industries) | ~7.7% (2025) | Expect constrained growth; prioritize high-yield channels | Gartner via Campaign |
| Budget composition (share of marketing budget) | Paid media 30.6%; Martech 22.4%; Labor 21.9%; Agencies 20.7% | Paid media remains largest line; rationalize tools & headcount | Chief Marketer (Gartner CMO) |
| Public SaaS S&M % of revenue (median) | ~38% (2025 snapshots) | Useful peer context for aggressiveness of GTM spend | Clouded Judgement (J. Ball) |
| Private B2B SaaS spend (marketing / sales) | Marketing 8% ARR; Sales 13% ARR (median) | Triangulate CAC & payback vs. peers | SaaS Capital (2025) |
| Global digital ad share | >75% of total media (2025) | Bias mix to digital channels; invest in video/CTV where relevant | Insider Intelligence / eMarketer |
What this means for HOLD.co’s portfolio marketing playbooks
- Balance demand creation vs. capture. Apply the 95–5 rule: maintain out-of-market reach (brand/content/video) while capturing in-market demand (SEO, review sites, marketplaces, paid search). Measure with share of search and branded organic growth. LinkedIn Business Solutions WARC
- Meet buyers where they buy. Prioritize self-serve workflows, transparent pricing, and marketplace procurement options; enterprise buyers are comfortable transacting online at higher deal sizes. Forrester McKinsey & Company
- Operationalize trust. Systematize proof (reviews, case studies, verified benchmarks) across all paid & organic touchpoints; align GEO (generative engine optimization) to how AI surfaces vendor choices. images.g2crowd.com SaaStr
- Set hard efficiency gates. Fund motions that clear LTV:CAC ≥ 3:1 and CAC payback within segment thresholds; re-route spend from underperforming channels to organic, review sites, and marketplace co-sell. For Entrepreneurs First Page Sage
Consumer & Buyer Behavior Trends
Changing customer needs & expectations
- Digital-first, self-serve, and marketplace-led: In B2B software, 71% of sellers now offer e-commerce and online accounts for ~34% of revenue, while >50% of US$1M+ deals are forecast to transact via digital self-serve in 2025. McKinsey & Company Digital Commerce 360 Forrester
- Later sales engagement & tighter shortlists: Buyers increasingly avoid sales early. G2’s 2025 study shows preference for rep contact shifted from Research (2024: 43%) toward Evaluation (35%) and Decision (27%) in 2025, with shortlists compressing to 2–3 vendors and “no-shortlist” paths rising. Images.g2crowd.com
- AI-mediated discovery and proof of value: Enterprise buyers rank AI search and review sites above Google for research and shortlisting; GenAI chatbots are now twice as influential as salespeople in shortlist formation. Buyers expect AI capabilities and many will pay a premium when ROI is clear. images.g2crowd.com
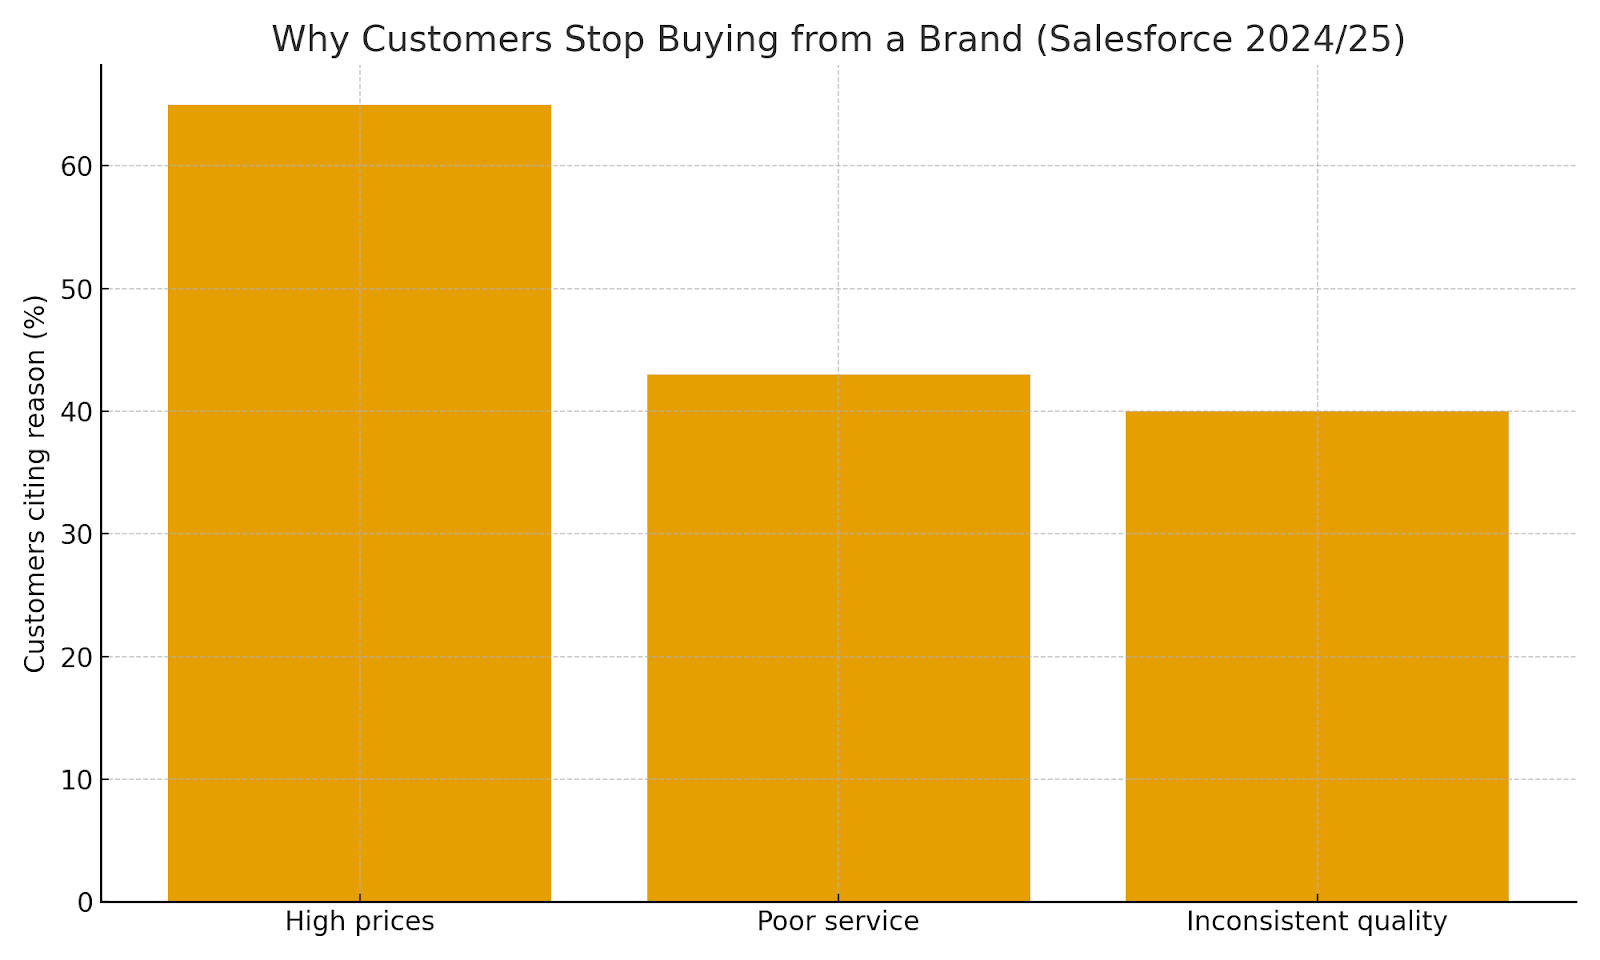
- Trust, pricing transparency, and service drive loyalty: High prices (65%) and poor service (43%) are top reasons customers stop buying; 42% trust businesses to use AI ethically and 71% want human validation of AI outputs. Salesforce
- Search behavior is changing: 72% of software buyers encounter Google AI Overviews during research and 90% click through to at least one cited source; transparent pricing is the #1 buyer request. go.trustradius.com

Key buyer needs & signals
| Trend | 2025 Stat / Signal | What it means | Source |
|---|---|---|---|
| Younger, digital-native buyers | Millennials/Gen Z are 71–73% of B2B buyers; 44% are final decision-makers | Design journeys for mobile-first, transparent, self-serve decisioning | Forrester; LinkedIn (via DC360) |
| Complex, multi-stakeholder buying | Typical buying group: 6–10 stakeholders | Multi-threaded enablement and role-based content are mandatory | Gartner |
| Self-serve & e-commerce | 71% offer e-commerce; ~34% of B2B revenue online | Invest in digital transactions, PLG trials, and transparent pricing | McKinsey |
| Large deals go digital | >50% of US$1M+ purchases via digital self-serve | Enterprise-grade checkout, security reviews, and marketplace procurement | Forrester |
| AI-mediated discovery | AI search & review sites outrank Google in enterprise research/shortlists | Optimize for LLM/AI answers and review quality; tighten positioning | G2 Buyer Behavior 2025 |
| Later sales engagement | Pref. for rep contact shifts to Evaluation (35%) / Decision (27%) | Front-load proof and social proof; enable late-stage acceleration | G2 |
| Trust & pricing transparency | 65% cite high prices; 43% cite poor service as churn triggers | Value-based pricing, clear TCO, and premium support matter | Salesforce |
| AI Overviews reshape search | 72% encounter AI Overviews; 90% click at least one cited source | Own citations and structured data; ensure review coverage | TrustRadius |
Demographic & psychographic shifts
- Millennial & Gen Z dominance is now established (71–73% of buyers; 44% final decision-makers), bringing consumer-grade expectations for UX, speed, social proof, and transparent pricing. Forrester Digital Commerce 360
- Privacy and AI trust gap: Customers feel more “seen” by personalization but are more protective of data (71%); only 42% trust firms to use AI ethically and 73% want disclosure when interacting with AI. Salesforce
- Committee buying persists: 6–10 stakeholders consult multiple sources; enablement must reconcile diverse roles and risk thresholds. Gartner
Industry-specific usage & purchasing patterns (software)
- AI & reviews shape the funnel: AI search and software review websites have become the top external sources for shortlisting; shortlists shrinking to 2–3 amplifies the cost of missing early visibility. images.g2crowd.com
- Marketplace procurement surges: ~62–63% of software firms report net-new revenue and customer acquisition via cloud marketplaces; hyperscaler co-sell programs expanded in 2025. Clazar Redmond Channel Partner Amazon Web Services, Inc.
- B2C software & apps: Subscription markets are maturing—bundles and ad-supported tiers reduce churn; return acquisitions ≈20% of new subs; trial length (17–32 days) correlates with the highest conversion. Subscription Insider Digital Content Next RevenueCat
NPS benchmarks & retention metrics
- NPS: Benchmarks vary by source; B2B Software & SaaS averages ~36–41 (CustomerGauge +36; Retently +41). Track trend vs. peers rather than fixate on absolutes. Customer Gauge Retently CX
- Retention: In private, bootstrapped SaaS (ARR $3–20M), median NRR = 104% and median GRR = 92% (2025). Companies with NRR ≥100% grow ~49.5% YoY on average. SaaS Capital Chart Mogul
NPS & retention snapshot
| Metric | Benchmark (2024–2025) | Use/Interpretation | Source |
|---|---|---|---|
| Average NPS — B2B Software & SaaS | ~41 | Healthy; target sustained + improvements by segment | Retently (2025) |
| Average NPS — SaaS (alt.) | ~36 | Cross-check across panels; avoid single-source absolutism | CustomerGauge (2025) |
| Median Net Revenue Retention (NRR) | 104% (bootstrapped, $3–20M ARR) | Best mid-market bar for expansion & churn offset | SaaS Capital (2025) |
| Median Gross Revenue Retention (GRR) | 92% (bootstrapped, $3–20M ARR) | Core health metric; aligns with 8–10% annual logo churn | SaaS Capital (2025) |
| Growth impact of strong retention | NRR ≥100% → ~49.5% YoY growth | Retention is the strongest driver of durable growth | ChartMogul |
B2C vs B2B buying cycle evolution (software)
- B2B: Digital self-serve and marketplaces dominate top-of-funnel discovery and procurement; larger deals moving online; committees enlarge complexity; buyers delay sales contact; AI/reviews carry disproportionate influence. Forrester McKinsey & Company Gartner images.g2crowd.com
- B2C (consumer apps & services): Subscriptions mature with bundle economics and ad-supported tiers; retention tactics (pause plans, flexible billing) matter; longer trials (17–32 days) yield higher conversion; churn pressures remain but are stabilizing in premium SVOD. Subscription Insider Digital Content Next RevenueCat
B2C vs B2B comparison
| Aspect | B2B Software | B2C Software/Apps | References |
|---|---|---|---|
| Decision structure | 6–10 stakeholders; consensus-driven | Individual/household; impulse tempered by reviews | Gartner |
| Channel shift | E-commerce ~34% of revenue; >50% large deals via self-serve | App stores, web, bundles; ad-supported plans growing | McKinsey; Forrester; Antenna (via Subscription Insider) |
| Discovery & evaluation | AI answers + review sites outrank Google in enterprise; shortlists 2–3 | Store rankings, creator reviews, social proof drive trials | G2 |
| Sales engagement | Rep contact later (Eval/Decision) | Self-serve; in-product prompts replace sales | G2 |
| Conversion levers | Marketplace private offers; procurement alignment | Trial length (17–32 days) maximizes conversion | Clazar 2025; RevenueCat 2025 |
| Loyalty drivers | Value proof, security, support SLAs | Price, content/features, frictionless CX | Salesforce |
Notes on interpretation
- Generational shift + AI-mediated research compress choice sets and raise the bar for transparent, review-backed proof of value. (See G2 2025, TrustRadius 2025.) images.g2crowd.com go.trustradius.com
- Digital procurement and marketplaces are no longer just shortcuts—they’re growth channels generating net-new revenue with hyperscaler co-sell tailwinds. Clazar Amazon Web Services, Inc.
- Retention is strategy: Benchmarks show NRR ≥100% correlates with outsized growth; use NPS as a directional gauge, complement with GRR/NRR and cohort health. ChartMogul SaaS Capital
Key Risks & Threats — Information Tech & Software
Below is a concise, data-sourced view of the sector’s principal downside risks, how moats erode, concentration exposures, the real barriers (entry vs. scale), and the litigation/regulatory headwinds most likely to affect HOLD.co’s decision-making over the next 12–24 months.
Industry-Specific Risk Factors (tech disruption, policy, pricing pressure)
- Compute & power constraints lengthen delivery timelines and inflate COGS. Data-center operators report worsening power availability bottlenecks, rising costs, and grid-connection delays, even as AI workload density climbs; vacancy rates are at record lows and grid interconnects can take ~4 years in key U.S. markets. Uptime Institute Data Center Knowledge TechRadar
- Advanced packaging / HBM supply is a gating factor for AI roadmaps. CoWoS capacity continues to be the bottleneck; TrendForce expects 2025 output to roughly double but demand still outpaces supply. HBM supply for 2025 is substantially sold out, per Micron/SK hynix disclosures. TrendForce+1 Micron Technology Tom's Hardware
- Software supply-chain exposure is rising fast. Malicious open-source packages detected surged ~188% YoY in Q2’25; data-exfiltration malware dominates, increasing risk for CI/CD secrets and developer credentials. Sonatype Dark Reading
- Buyer scrutiny → pricing pressure & longer cycles. CIO/buyer surveys show tighter IT budget scrutiny despite headline growth; cloud cost governance remains the #1 challenge and 84% of orgs struggle to manage cloud spend, pressuring vendors to deliver measurable value. Bain Flexera
- Policy & disclosure shocks. Public companies must disclose material cyber incidents within four business days (Form 8-K Item 1.05), raising reputational and legal stakes. SEC The CPA Journal
- AI & platform regulation change competitive economics. The EU AI Act imposes transparency/copyright obligations on GPAI providers from Aug 2, 2025 with stricter duties for “systemic risk” models, while the EU Data Act (applicable Sept 12, 2025) and hyperscalers’ egress-fee waivers reduce switching frictions (i.e., weaken lock-in). Digital Strategy Europe+2 Amazon Web Services, Inc. Google Cloud
Risk Matrix (Embed in Webflow)
| Risk domain | What could happen | Likelihood (12–24 mo) | Impact | Key timeframe | Sources |
| Power & capacity bottlenecks | Delayed AI rollouts due to grid interconnects, rising electricity costs, limited high-density colo. | High | High (COGS, delivery) | Near-term ongoing | Uptime 2025; TechRadar/JLL |
| HBM/CoWoS supply | Packaging and HBM scarcity pushes out AI product timelines; costs remain elevated. | High | High | 2025–26 | TrendForce; Micron IR; Tom's Hardware |
| Software supply-chain | OSS malware (+188% YoY) exfiltrates secrets via npm/PyPI, compromising CI/CD and customer data. | High | High (security, legal) | Now | Sonatype Q2’25; Dark Reading |
| Buyer scrutiny & pricing | Longer approvals, discounting pressure; FinOps demands measurable ROI from SaaS/AI features. | Medium-High | Medium | 2025–26 | Bain CIO survey; Flexera 2025 |
| Disclosure shock | Mandatory 4-day cyber incident disclosures increase litigation/reputational risk. | Medium | Medium-High | Now | SEC speech; CPA Journal |
| Regulatory reset (EU) | AI Act duties (Aug 2025 onward) and Data Act switching rules force product and contract changes. | High | Medium-High | 2025–27 | EU AI Act timeline; EU Data Act |
| Platform rule enforcement | DMA actions curb anti-steering/data practices; moats tied to platforms weaken. | Medium | Medium | 2025 | EC press release; EP Think Tank |
Competitive Moats & Erosion Factors
- Switching costs → lower: The EU Data Act forces cloud portability and contractual “switching” facilitation from Sept 12, 2025, and AWS/Google now waive egress fees for customers exiting their clouds—undermining historical data-gravity moats. Digital Strategy Europe, Amazon Web Services, Inc., Google Cloud
- Distribution power → constrained: DMA anti-steering enforcement (e.g., Apple/Meta non-compliance findings) weakens gatekeeper control over app/payment routing and data use—eroding incumbents’ platform moats. European Commission, Digital Strategy Europe
- Data moats → regulated access & provenance: AI Act (GPAI) transparency/copyright duties and GDPR enforcement (fines >€5.6B cumulative across 2018–2024) raise the bar on lawful data use and explainability, reducing “free” data advantages. Digital Strategy Europe, Lexology
- Feature moats → commoditization via AI & OSS: Rapid diffusion of AI capabilities and open models is shifting value from features to data quality, workflows, and infra economics; smaller efficient models (e.g., DeepSeek class) and infra choices can blunt proprietary feature edges. Financial Times
Moats vs. Erosion
Key-Man Risk & Vendor/Client Concentration
- Key-man (“bus factor”) in software & OSS: Large-scale analyses show many OSS projects depend on one core developer, and loss of core teams is common—directly relevant for smaller acquisitions with OSS underpinnings. arXiv, ACM Digital Library
- Client concentration: Smaller B2B SaaS often rely on a handful of enterprise customers; academic literature highlights governance/reporting issues with concentrated customer bases, a proxy for fragility in downturns. ScienceDirect, PayPro Global
- Channel/platform concentration: Reliance on a single hyperscaler for distribution/billing or on marketplace incentives can concentrate revenue and policy risk; ongoing UK/EU competition probes underscore this exposure. Reuters
Barriers to Entry vs. Barriers to Scale
- Entry (lowering): OSS stacks + cloud services reduce upfront capex and time-to-market.
- Scale (rising):
- Security/compliance: Enterprise procurement increasingly expects SOC 2/ISO 27001; U.S. public-sector routes require FedRAMP (now on Rev. 5/20x path), a multi-month/-year journey. fedramp.gov, Schellman Compliance
- Infra & power: High-density racks, AI accelerators, and grid constraints limit scale-out capability. Uptime Institute
- Advanced packaging/HBM: Capacity scarcity can delay scale plans even for well-funded teams. TrendForce
Barriers Snapshot
| Barrier | Entry or Scale? | Why it matters | Sources |
| Security attestations (SOC 2 / ISO 27001) | Scale | Table-stakes for enterprise; needed to clear vendor risk reviews | Schellman explainer |
| FedRAMP (U.S. public sector) | Scale | Authorization prerequisites gate government TAM; Rev.5/20x modernizing but still heavy | FedRAMP; Washington Technology |
| Power & real estate for AI | Scale | Limited power availability and long interconnect lead times | Uptime 2025 |
| Advanced packaging/HBM | Scale | Packaging capacity/HBM availability constrain accelerator supply | TrendForce; Micron IR |
Litigation & Regulatory Exposure
- Privacy & data protection (GDPR). EU DPAs have levied >€5.6B in cumulative fines (2018–2024); enforcement continues in 2025 across sectors. Lexology
- AI copyright & scraping litigation. Ongoing cases (e.g., NYT v. OpenAI/Microsoft; Getty v. Stability AI in UK) keep training-data legality and CMI/DMCA theories in flux—implications for vendors embedding GenAI. Reuters Courts and Tribunals Judiciary
- Platform regulation (DMA). 2025 non-compliance decisions against Apple/Meta illustrate the EU’s willingness to fine gatekeepers and order conduct changes affecting discovery, payments, and data use. European Commission Digital Strategy Europe
- Cyber incident disclosure (SEC). Form 8-K Item 1.05 mandates rapid public disclosure—raising litigation risk post-incident and incentivizing stronger incident response and materiality processes. SEC
- Cloud portability & contracting. The EU Data Act becomes applicable Sept 12, 2025 ; the Commission is preparing model contractual terms to accelerate data-sharing/switching arrangements, impacting licensing and SLAs. Digital Strategy Europe Skadden
Regulatory Snapshot (with links)
| Regime | Trigger | Potential exposure | Timing | Sources |
| SEC Cyber Disclosure (US) | Material cyber incident | Mandatory Form 8-K (Item 1.05) within 4 business days; enforcement risk | In force | SEC C&DI; CPA Journal (2025) |
| EU AI Act (GPAI/Systemic risk) | GPAI models placed on EU market; systemic risk threshold | Transparency, copyright, risk-management obligations; penalties for non-compliance | GPAI duties from Aug 2, 2025; phased | EC (Aug 2025) |
| EU Data Act | Cloud/service switching & data-sharing | Portability clauses; model terms; impacts pricing/egress/lock-in | Applicable Sept 12, 2025 | EC overview; Skadden (2025) |
| EU Digital Markets Act | Gatekeeper conduct (anti-steering, data use, self-preferencing) | Fines up to 10% of global turnover; behavioral remedies | Active enforcement (2025 fines) | EC DMA news |
| GDPR | Processing of personal data in EU/UK | Administrative fines (up to 4% global turnover) + remedies | Ongoing | CMS Enforcement Tracker; ET Report 2025 |
What this means for HOLD.co (risk posture summary)
- Execution risk is infra-bound: Power/packaging/HBM constraints can slow value realization in AI-heavy theses even when demand is strong. Expect longer lead times and front-loaded capex/opex. Data Center Knowledge Trend Force
- Moats will shift from “owning” data/rails to contracting, trust, and workflow fit: Portability and platform rules are structurally reducing lock-in; advantage accrues to vendors with verifiable ROI, strong security posture, and compliance readiness. Digital Strategy Europe+1
- Diligence depth must increase on OSS & concentration: Assess dependency on single maintainers/components (“bus factor”) and channel/platform concentration (e.g., reliance on one hyperscaler). arXiv
Strategic Fit & Synergy Opportunities for HOLD.co
Vertical & Horizontal Integration Opportunities
Vertical integration (up/down the buyer workflow).
- Security/platform consolidation: Buyers are actively reducing vendor counts—75% of security buyers are pursuing consolidation—favoring integrated platforms (e.g., XDR/SASE). Targets that replace multiple point tools strengthen pricing power and land-and-expand potential. eSecurity Planet Thrive media.e92plus.com
- Observability & DevOps toolchains: Enterprises are consolidating monitoring/observability for cost and speed; OpenTelemetry standardization supports integration plays. Chronosphere Catchpoint
- Cloud marketplaces & co-sell (procurement “rail” integration): Listing and co-selling through AWS/Azure/GCP creates net-new demand (not just deal rerouting)—62% of vendors attribute marketplace revenue to net-new; co-sell deals are 40% larger / 20% faster in aggregate studies. clazar.io +1 Tackle.io
Horizontal integration (same ICP, adjacent problem).
Programmatic M&A in IT/software has outperformed “one-off” deals and is associated with superior TSR when capability building is the goal. Revenue synergies are central in ~50% of software deals (vs. ~25% cross-industry), but typically materialize over ~2 years—plan early. McKinsey & Company Boston Consulting Group BCG
Integration map
| Play | Fit with HOLD.co | Evidence of value | References |
|---|---|---|---|
| Vertical: Security platformization (XDR/SASE) | Acquire complementary security modules; unify policy, telemetry & pricing | 75% of buyers consolidating vendors; preference for integrated suites | Gartner talk via eSecurityPlanet; Gartner trends |
| Vertical: Observability stack consolidation | Combine APM, logs, metrics under one SKU with OTel | Enterprises seek fewer tools; consolidation for speed & cost | 451 Research (via Chronosphere); Catchpoint |
| Horizontal: Cloud Marketplace “rail” | Standardize SKUs & private offers across AWS/Azure/GCP; incent co-sell | 62% report net-new revenue; co-sell deals 40% larger & 20% faster | Clazar 2025; Tackle 2024 |
Portfolio Synergies (Ops, Sales, Distribution, Tech, Data)
Sales & distribution synergies
- Cloud co-sell & marketplace: AWS-commissioned Forrester analysis shows win rates +27% and customer spend +80% when transacting through AWS Marketplace; AWS ISV Accelerate formalizes co-sell motions. Amazon Web Services, Inc. Amazon Web Services, Inc.
- Deal velocity & size: Tackle finds +40% ACV and -20% cycle time for co-sell vs. non-co-sell deals. Tackle.io
- Net-new demand: Majority of marketplace revenue is incremental, not cannibalized. clazar.io
Operating cost synergies
- Procurement: World-class procurement can reduce the purchasing cost base 8–12%, with +2–3% annual tailwinds thereafter; procurement is often ≥1/3 of total synergies captured within 12 months post-close. Bain Bain Media McKinsey & Company
- Cloud FinOps: Deloitte projects US$21B enterprise savings in 2025 from FinOps, with some organizations cutting cloud cost by up to 40%; optimization remains the top FinOps priority. Deloitte FinOps Data
- SaaS spend hygiene: Studies show ~30% of SaaS outlay is wasted on unused licenses/features—ripe for centralized portfolio negotiations. NPI Financial
Technology & talent synergies
- GenAI-assisted engineering: McKinsey finds developers can complete coding tasks up to 2× faster with gen-AI; IBM Software observed 30–40% productivity gains. McKinsey & Company
Data & customer value synergies
- Retention compounding: Firms with NRR >100% grow 1.5–3× faster; a unified cross-sell engine that raises NRR is the most durable growth lever. ChartMogul
Synergy levers & quantified upside
| Synergy lever | Portfolio action | Indicative upside | Source |
|---|---|---|---|
| Cloud marketplace + co-sell | Standardize listings; private offers; ISV Accelerate | Win rate +27%; customer spend +80% | Forrester for AWS |
| Co-sell velocity & ACV | Joint pipeline with hyperscalers; attach credits | ACV +40%; cycle time −20% | Tackle (2024) |
| Procurement synergy | Centralize vendor mgmt; harmonize contracts | 8–12% cost-base reduction; +2–3%/yr thereafter | Bain |
| Cloud FinOps | Common tagging, rightsizing, RIs/SPs; FinOps PMO | US$21B 2025 savings potential (macro); up to −40% cost per firm | Deloitte TMT 2025 |
| GenAI for engineering | Copilots; code assist; test generation | Up to 2× faster coding; 30–40% productivity gain (IBM) | McKinsey; McKinsey (IBM case) |
| NRR flywheel | Unified pricing/packaging; cross-sell playbooks | NRR >100% ⇒ 1.5–3× faster growth | ChartMogul |
Shared Services Potential (HR, Legal, Finance, IT, Creative)
- GBS (shared services) savings: Deloitte’s 2025 GBS Survey reports ~50% of organizations achieved >20% savings from GBS—signaling real scope for portfolio-level shared services (finance operations, HR ops, legal ops, creative/brand studio, IT service desk). Yahoo Finance
- Where savings concentrate: Procurement, cloud/IT, and SaaS-license governance routinely drive the majority of early wins. McKinsey & Company Bain NPI Financial
Shared services blueprint
| Function | Centralized capability | Expected benefit | References |
|---|---|---|---|
| Finance Ops | GBS for AP/AR, close, RevOps analytics | >20% run-rate savings achievable in many orgs | Deloitte GBS 2025 (news) |
| IT & Cloud | FinOps CoE; common tagging/budgets; infra buying | Up to −40% cloud cost (firm-level); US$21B macro savings | Deloitte TMT 2025 |
| Procurement | Category mgmt; vendor rationalization; portfolio pricing | 8–12% purchasing cost reduction + 2–3%/yr | Bain |
| Legal Ops | Standard MSAs/DPA/SLA library; privacy/compliance | Cycle-time reduction, lower outside counsel spend | Deloitte GBS 2025 |
| Creative/Brand | Shared brand studio & asset DAM | Lower CAC via content reuse, faster launches | Deloitte SSC insights |
Exit Potential & Monetization Pathways (Roll-ups, IPO, Divestiture)
(A) Buy-and-build / roll-ups.
- Why now: 2024–2025 deal markets show a gradual recovery; software remains an active subsector. Programmatic M&A tends to outperform and spreads capability quickly across a platform. McKinsey & Company
- Revenue synergy realism: Cross-sell often contributes ~20% of revenue synergy value, but <20% of firms hit cross-sell goals—process and enablement matter. McKinsey & Company
(B) IPO option (select assets).
- Window: US IPO activity rebounded in 2025; YTD IPOs and index returns imply improving receptivity (e.g., Renaissance data & preview). Cloud comps trade near ~8–9× EV/Revenue (EMCLOUD). IPOs that succeed show stronger revenue/profitability vs. 2021 cohort. Renaissance Capital The BVP Nasdaq Emerging Cloud Index Investopedia
(C) Corporate carve-out / divestiture.
- Speed & value: Pre-packaged carve-outs can cut ~40% from time-to-close; carve-outs historically delivered high MOIC, though average returns have normalized post-2012—operator excellence is decisive. Boston Consulting Group Bain Finhouse
Exit pathways & gating criteria
What this means for HOLD.co — concrete moves
- Make cloud “rails” a default for portfolio sales. Require marketplace listings + co-sell eligibility in 90 days post-close; attach hyperscaler commit-credits to catalyze ACV growth. (Win-rate +27%, spend +80%; ACV +40%, cycle −20%.) Amazon Web Services Tackle.io
- Stand up a Portfolio FinOps & Procurement Office. Centralize RI/SP management, SKU right-sizing, and SaaS license governance; target 8–12% purchasing savings and up to 40% cloud cost reduction over 12–18 months. Bain Deloitte
- GBS build-out for Finance/HR/Legal/Creative. Aim for >20% run-rate savings with standardized MSAs/DPAs, RevOps analytics, shared brand studio and DAM. Yahoo Finance
- Engineer productivity program. Deploy gen-AI copilots and test-gen across portfolio SDLC; success benchmark: 30–40% productivity lift, measured as story points/engineer and MTTR. McKinsey & Company
- Plan exit paths early. For “platform” assets with NRR ≥100% and 20%+ growth, prepare dual-track (IPO/M&A); for non-core units, pre-package carve-outs to compress timelines by ~40%. ChartMogul The BVP Nasdaq Emerging Cloud Index Boston Consulting Group
Strategic Recommendations
Acquisition Criteria Refinement (financial, cultural, operational)
| Dimension | Screening Thresholds | Why It Matters | Evidence / Benchmarks (links) |
|---|---|---|---|
| Revenue scale & growth | $5–$75M ARR; YoY growth ≥25% (≥30% for AI-native) | Balances tuck-in feasibility with materiality; growth ≥ sector medians | SaaS Capital 2025 growth medians; BVP Cloud 100 growth (AI) |
| Retention quality | NRR ≥104%; GRR ≥90–92% | Predicts durable expansion & cash efficiency | SaaS Capital 2025 NRR/GRR |
| Unit economics | CAC payback ≤18 months (≤12 months SMB/mid-market) | Shorter payback compounds FCF and lowers risk | FirstPageSage CAC payback |
| Gross margin | ≥70% total; ≥75% subscription | Cloud businesses cluster 65–80%; low COGS increases valuation | BVP EMCLOUD metrics; KeyBanc/Sapphire 2024 |
| Marketplace / co-sell readiness | Listed or 90-day path to AWS/Azure/GCP marketplaces; co-sell eligible | Accelerates win rate, ACV, and cycle time | Forrester for AWS (win rate +27%, spend +80%); Tackle 2024 (ACV +40%, cycle −20%) |
| Security & compliance | Current SOC 2 Type II or ISO 27001; privacy readiness (GDPR/CCPA) | Table stakes for enterprise deals & diligence | Secureframe |
| Cultural & operating fit | Product-led DNA; agile SDLC; integration openness (APIs/OTel) | Reduces post-close friction; speeds synergy capture (~2 yrs) | BCG software M&A (synergy timing) |
Rationale: thresholds benchmark above current private SaaS medians (growth ~19–25%, NRR ~101–104%) and align with public cloud valuation drivers (growth + margins). SaaS Capital+1 info.sapphireventures.com CFO Desk Israel
Near-Term Acquisition Targets or Partnership Suggestions
A) Partnerships to execute now (priority)
| Program / Vendor | Why (data) | What to implement | Reference |
|---|---|---|---|
| AWS Marketplace + ISV Accelerate | Win rate +27%; buyer spend +80% vs off-marketplace | List SKUs; private offers; co-sell pipeline & attribution | Forrester TEI (AWS) |
| Microsoft Azure IP Co-sell | Field co-sell access; multiyear (≤5 yr) marketplace contracts | Achieve co-sell-ready; register deals; align to MACC | MSFT co-sell requirements; Marketplace updates (2025) |
| Google Cloud Marketplace Private Offers / MCPO | Counts toward customer commit; channel private offers growth | Enable private offers; reseller plans; deal reg with PS Console | GCP private offers; CRN (2025) |
| Cloud GTM tooling (Tackle, Clazar) | Co-sell deals ~40% larger & 20% faster; 62% net-new via marketplaces | Operationalize listings, co-sell, RevOps attribution | Tackle 2024; Clazar 2025 |
| FinOps (Deloitte playbooks; Flexera insights) | Up to 40% cloud cost reduction; $21B savings potential (2025) | Portfolio FinOps PMO; tagging, RIs/SPs, showback/chargeback | Deloitte TMT 2025; Flexera 2025 |
Why now: Marketplace + co-sell motions are producing net-new demand (not just rerouting) and measurable sales lift; FinOps unlocks self-funding synergies to reinvest in M&A. clazar.io
B) Target archetypes & sourcing signals (illustrative, diligence required)
| Segment | Customer Pain / Synergy to HOLD.co | Screening Signals | Reference |
|---|---|---|---|
| FinOps & cloud cost optimization | Immediate OPEX savings across portfolio; upsell to existing cloud spend | ARR $5–30M; ≥70% GM; integrations with AWS/Azure/GCP billing | Flexera 2025 (84% struggle); Deloitte TMT 2025 |
| Observability & telemetry pipelines (OTel-aligned) | Consolidation trend; data reduction lowers COGS | OTel-native; data control/SLG features; marketplace listing | 451 Research (obs. growth); 451 Alliance (pipelines M&A) |
| Security: compliance automation & platformization | Rising buyer consolidation to fewer vendors; cross-sell security SKUs | NRR ≥110%; integrations into E5/AWS accounts; SOC 2 Type II | Gartner (75% consolidating); SOC 2 table stakes |
| Data governance/lineage | AI adoption needs quality & lineage; adds value across portfolio products | Enterprise connectors; policy automation; privacy workflows | S&P/451 Research agenda |
| Marketplace GTM enablers | Scales co-sell & private offers across all portfolio companies | CRM integration; RevOps attribution; AE incentive tooling | Tackle 2024; Clazar 2025 |
Buy-and-Build vs. Single-Anchor Strategy
Decision rule (evidence-led):
- Choose buy-and-build (programmatic M&A) when the niche is fragmented, cross-sell is credible, and marketplace/co-sell can lift ACV & velocity; programmatic acquirers have outperformed other M&A styles over time. McKinsey & Company McKinsey & Company
Choose a single-anchor when category leadership, network effects, or regulatory moats dominate and integration capacity is limited; synergy realization typically takes ~2 years in software—avoid overloading the pipeline. BCG
| Approach | When to Prefer | KPI Gates | Reference |
|---|---|---|---|
| Buy-and-build (programmatic) | Fragmented submarkets; attach/cross-sell plausible; integration muscle in place | NRR ≥100%; GM ≥70%; CAC pb ≤18m; co-sell readiness | McKinsey |
| Single anchor | Clear winner with strong moat; complex regulatory or platform dependencies | Rule-of-40 ≥40; efficient growth; robust governance/compliance | BCG (software synergies) |
Contacts Template (fill with HOLD.co details)
Notes on provenance & dates
- Cloud market: Q1–Q2 2025 spend & growth from Synergy Research press (and trade coverage). Synergy Research Group+1 Fierce Network
- FinOps pressure: Flexera 2025 report highlights pervasive spend management challenges (84%). Flexera
- Buyer behavior & budgets: Forrester (digital self-serve for large deals), TrustRadius (AI Overviews behavior), Gartner CMO survey (7.7% budgets; 30.6% paid media). Forrester TrustRadius for Vendors Campaign Live Chief Marketer
- Security posture: Verizon DBIR 2025, IBM breach costs 2025, Sonatype OS malware index. Verizon IBM Sonatype
- Regulatory: EU AI Act/GPAI (Aug 2, 2025), CRA (Dec 11, 2027), Data Act (Sept 12, 2025), DSA transparency windows, DMA enforcements (2025), SEC 8-K C&DI, PCI DSS v4 effective Mar 31, 2025. Digital Strategy Europe+4 SEC PCI Perspectives
Considering a transaction?
Speak with our team about an acquisition, partnership, or exit — in confidence.