
The global e-commerce/retail sector is entering a recalibration phase: growth remains structurally positive, but 2025 is a slower year before a projected re-acceleration in 2026 as macro and trade headwinds ease.
Online’s share continues its steady climb— e-commerce reached ~16.3% of total US retail sales in Q2-2025 (seasonally adjusted)— while overall US retail is expected to expand a modest 2.7%–3.7% in 2025, creating a “steady but selective” demand environment for brands and platforms.
At the same time, US suspension of de minimis duty-free treatment (effective Aug 29, 2025) is reshaping cross-border unit economics and tilting advantage toward in-market inventory and compliant, localized fulfillment. EMARKETER FRED National Retail Federation Reuters
Marketing within this sector is evolving just as quickly. Retail/commerce media remains one of the fastest-growing ad channels (>$62B in US spend in 2025), but scale is concentrating around a few ecosystems (e.g., Amazon, Walmart), a trend reinforced by the blocked Kroger-Albertsons tie-up that would have created a stronger challenger network.
Privacy and attribution are also in flux: Google’s decision to retain third-party cookies in Chrome (Apr 2025) slows the immediate shift but keeps the strategic premium on first-party data and closed-loop measurement. Meanwhile, promotion-led demand and BNPL usage continue to buoy conversion in a value-conscious consumer cycle. EMARKETER The Wall Street Journal The Verge Adobe Newsroom
This marketing report provides a data-driven analysis of 2025 e-commerce/retail dynamics for HOLD.co—synthesizing the latest statistics, performance benchmarks, and channel trends—and translates them into practical investment and operating guidance. It surfaces how leaders are reallocating budgets (toward retail media, creator/affiliate, and CRM), which tactics and tools are outperforming, and the KPIs executives should track to align acquisition efforts with pipeline quality, repeat rates, and lifetime value.
High-level market outlook & investment thesis
- Outlook (2025–2028): Global retail e-commerce growth has cooled but remains structurally resilient; Insider Intelligence (eMarketer) expects a small dip in 2025 growth with re-acceleration from 2026 as macro headwinds (China softness, trade frictions) ease. Online’s share of total retail continues to grind higher. EMARKETER
- US baseline: E-commerce represented ~16.3% of US retail sales in Q2-2025 (SA) per Census/FRED, up from ~16.1% a year ago; Census’ headline (NSA) share prints 15.5%. FRED Census.gov
- Channel power shift: Retail/commerce media keeps outgrowing the broader ad market and is consolidating around a few scaled platforms (Amazon, Walmart), deepening the moats of ecosystems that control first-party purchase data. EMARKETER+2
- Regulatory reset: The Aug 29, 2025 US suspension of de minimis duty-free treatment for sub-$800 parcels materially changes cross-border unit economics and favors in-market inventory and domestic fulfillment. The White House U.S. Customs and Border Protection Reuters
- Investment thesis for HOLD.co: Prioritize assets with direct consumer relationships and first-party data (loyalty, subscriptions), diversified acquisition beyond paid social, and localized fulfillment to mitigate tariff/CBP frictions—while leveraging retail media and BNPL to defend conversion as ad platforms and privacy rules evolve. (Google’s April 2025 pivot to keep third-party cookies in Chrome slows—but doesn’t stop—the shift to first-party data.) The Verge
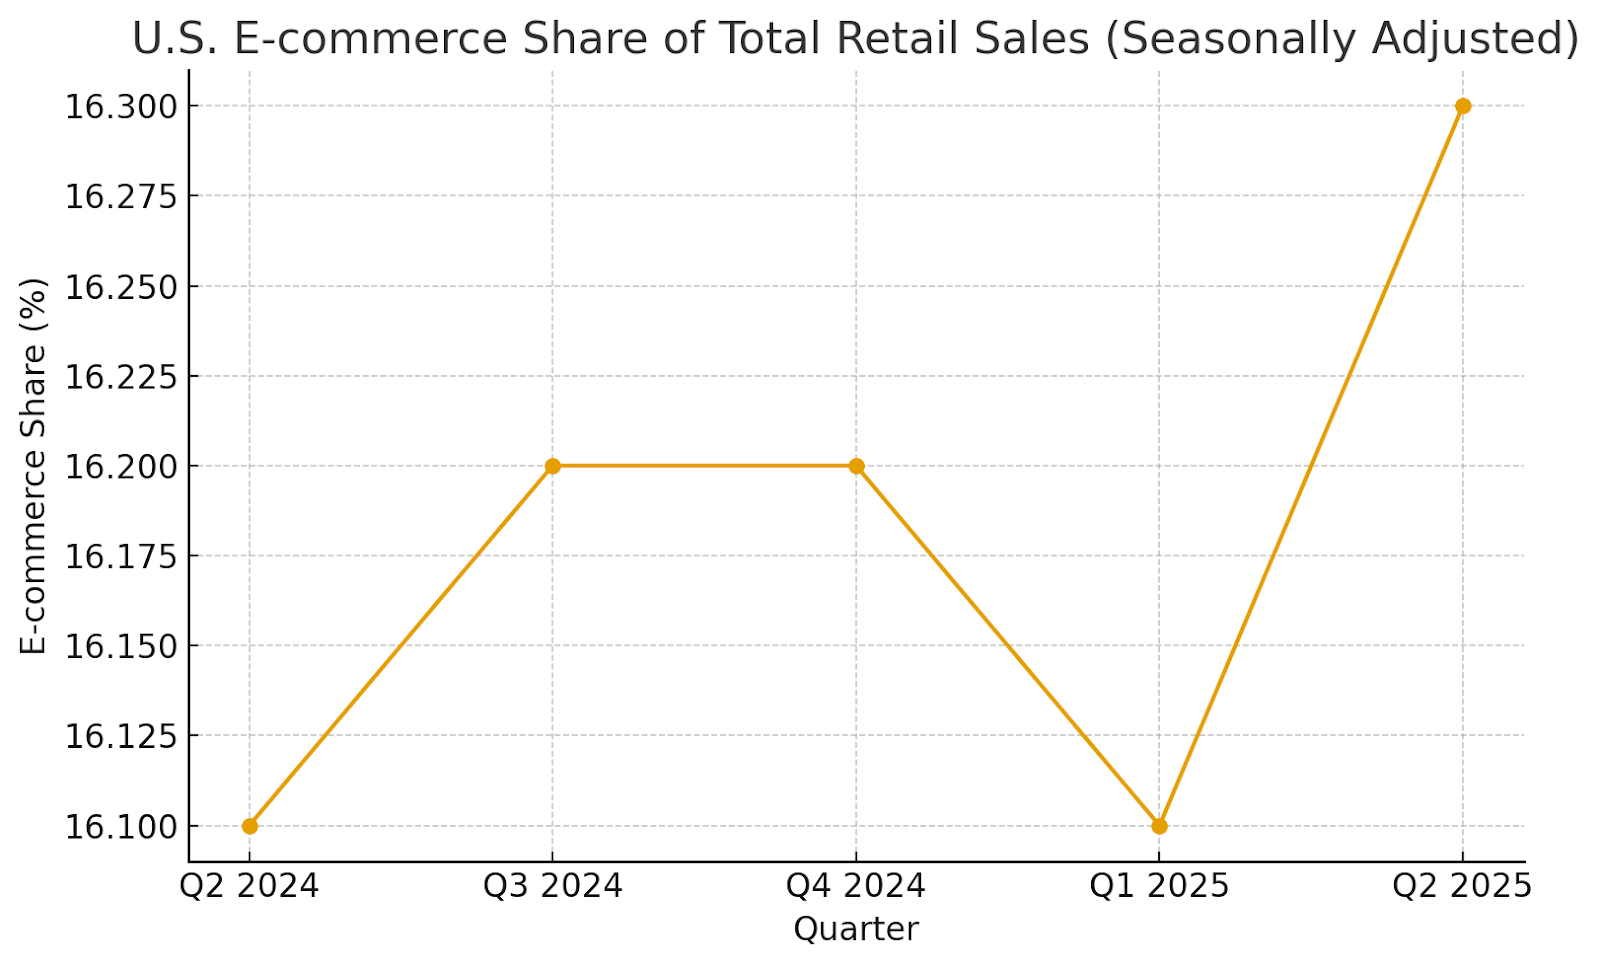
Source: US Census/FRED ECOMPCTSA. Values are seasonally adjusted. FRED
Key signals driving HOLD.co’s interest in E-commerce / Retail (2025)
| Signal | Latest datapoint (date) | Why it matters | Source |
|---|---|---|---|
| Online share of US retail | 16.3% SA in Q2-2025; 15.5% NSA | Structural, steady mix-shift to digital supports multi-year demand. | FRED (US Census) | US Census |
| Global e-commerce growth trajectory | 2025 deceleration; improvement expected in 2026+ | Macro drag in 2025 sets up re-acceleration window for disciplined buyers. | Insider Intelligence (eMarketer) |
| Retail/Commerce media momentum | Share of digital ads rising; >80% spend concentrated in US/China (2025) | High-ROI, SKU-level closed-loop measurement; advantaged first-party data. | Insider Intelligence (Retail Media) |
| US de minimis policy change | Duty-free $800 exemption suspended Aug 29, 2025 | Tilts advantage to domestic stock & compliant cross-border models. | White House EO | CBP FAQ | Reuters |
| Platform health (Shopify) | $292.3B GMV in 2024 (+24% YoY) | Merchant ecosystems remain robust; enables buy-and-build brand plays. | SEC 10-K (2024) |
| Payments/BNPL adoption | US BNPL hit record $991M on Cyber Monday ’24; 2025 usage still rising | Conversion lever in pressured wallets; drives AOV and checkout rates. | WSJ (Adobe Analytics) |
| US retail spending baseline | NRF sees 2025 retail +2.7% to +3.7% YoY | Macro “steady-ish” backdrop supports selective M&A and share gains. | NRF Forecast |
| Ad-tech/privacy environment | Google keeps third-party cookies (Apr 2025) | Less abrupt attribution shock, but first-party data advantage persists. | The Verge |
(Citations for the table above: FRED Census.gov EMARKETER+1 The White House U.S. Customs and Border Protection Reuters SEC The Wall Street Journal National Retail Federation The Verge)
Top 3–5 takeaways for acquisition or expansion strategy
- Localize fulfillment to defend gross margin post-de minimis. Stand up (or acquire) US/EU inventory positions and compliant cross-border rails; expect duty, brokerage, and processing to add friction and cost to DTC imports under $800, pulling conversion toward domestic stock and marketplaces with in-country inventory. The White House U.S. Customs and Border Protection
- Lean into retail/commerce media and first-party data where incremental ROI remains above blended CAC and measurement is closed-loop. Consolidate spend with platforms that have scaled audiences and onsite search (Amazon, Walmart) while testing offsite expansion as retail media grows share of digital. EMARKETER+1
- Prioritize assets with repeat purchase, low return rates, and durable LTV (e.g., replenishable categories, subscriptions, grocery-adjacent). BNPL usage and promotional spikes (Prime Day) are sustaining demand but favor operators with disciplined credit/returns management. Reuters The Wall Street Journal
- Omnichannel and grocery remain share-taking arenas. Online grocery sales in the US are expanding again, with MAU growth and big-box investment in perishable logistics—an attractive adjacency for last-mile and marketplace enablement plays. Mercatus The Wall Street Journal
- Platform ecosystems (e.g., Shopify) are healthy—and consolidating. With $292B+ GMV and improving free-cash-flow profiles, ecosystems that “sell shovels” to merchants remain attractive partners or tuck-in targets (apps, enablement, data). SEC
Summary of risks & opportunities
- Regulatory & trade risk (HIGH): The US de minimis suspension lifts landed costs, adds customs latency, and may trigger reciprocal policies; winners will pre-position stock and diversify sourcing. The White House Reuters
- Ad & attribution risk (MODERATE): Google’s cookie pivot reduces immediate breakage but does not remove the secular shift to privacy; diversify acquisition (retail media, creator/affiliate, CRM) and keep building first-party data/consent. The Verge
- Competition & consolidation (MODERATE): Amazon/Walmart dominance in retail media and e-commerce keeps pressure on smaller RMNs and mid-tail brands; focus on distinctive assortment, community, and in-market speed. EMARKETER
- Consumer wallet pressure (MODERATE): NRF projects ~3% retail growth in 2025 amid tariff-linked inflation and tepid sentiment; pricing power will be uneven, elevating the need for promotions and flexible payments (BNPL). National Retail Federation Investopedia The Wall Street Journal
- Opportunities:
- Local-for-local supply chains and domestic 3PL/MFC capacity to offset duty and transit delays. U.S. Customs and Border Protection
- Commerce media arbitrage: shift budget toward highest-ROAS retail networks and offsite extensions with closed-loop attribution. EMARKETER
- Grocery & essentials online (higher frequency, defensible LTV) and subscriptions/loyalty that deepen first-party datasets. Mercatus
Notes & sources (for this section)
- Global e-commerce outlook (2025–2028): Insider Intelligence / eMarketer. EMARKETER
- US e-commerce share & growth: US Census Q2-2025 release; FRED ECOMPCTSA. Census.gov FRED
- Retail/commerce media: Insider Intelligence retail media updates. EMARKETER+1
- De minimis suspension (effective Aug 29, 2025): White House EO; CBP guidance/FAQ; Reuters/AP coverage. The White House U.S. Customs and Border Protection Reuters AP News
- Platform health: Shopify 2024 GMV in SEC 10-K. SEC
- BNPL/holiday spend: Adobe Analytics via WSJ; Adobe holiday recap. The Wall Street Journal Adobe for Business
- US retail macro: NRF 2025 forecast; RetailDive context. National Retail Federation Retail Dive
Market Landscape Overview — E-commerce / Retail
TAM, SAM, CAGR
| Scope | 2025 Size | Definition / Notes | Forward View | Primary Source |
|---|---|---|---|---|
| Global Retail E-commerce (TAM) | $6.419T | Worldwide B2C retail e-commerce sales (all categories). | Growth slows in 2025, penetration >20% of global retail; re-acceleration expected from 2026. | Insider Intelligence / eMarketer (May 22, 2025) |
| US Retail E-commerce (SAM example) | $304.2B in Q2-2025 (SA); run-rate ≈ $1.22T | US Census quarterly e-commerce estimate; share of total retail 16.3% (SA) / 15.5% (NSA). | NRF expects total US retail +2.7%–3.7% in 2025 (macro baseline). | US Census Q2-2025 | NRF 2025 forecast |
| US Digital Grocery (category lens) | $220.5B (2025) | Online grocery incl. delivery & pickup; Walmart leads share. | Category remains one of the largest online verticals; maturation with leadership concentrated among a few scaled players. | Insider Intelligence / eMarketer (Jan 28, 2025) |
Sources: Global TAM and penetration (2025): EMARKETER+1. US e-commerce (Q2-2025 levels and shares): Census.gov. US retail macro context: National Retail Federation. Digital grocery: EMARKETER.
CAGR perspective (directional): Forrester projects global retail e-commerce to reach ~$6.8T by 2028, implying a ~1.9% CAGR from the $6.419T 2025 base (Forrester’s lower 2028 point vs. some eMarketer series). Use as a conservative planning case; reconcile with your internal market views per region/category. Forrester
Key segments & verticals within the industry
- Marketplaces: Amazon, Walmart, eBay; cross-border/discount plays (Temu, SHEIN) are meaningful traffic sources but face higher regulatory friction in the US. Amazon is forecast to capture ~40% of US e-commerce sales in 2025. EMARKETER
- Omnichannel Retailers: Big-box leaders (Walmart, Target, Costco, Kroger) use stores as fulfillment hubs to compress delivery windows and lower last-mile costs. The Wall Street Journal
- DTC/Brand sites: Powered by platforms like Shopify, BigCommerce, Salesforce Commerce Cloud; Shopify GMV $292.3B in 2024 signals ecosystem scale for enablement vendors and app partners. Q4 Inc.
- Retail/Commerce Media Networks (RMNs): High-growth ad channels leveraging first-party purchase data (Amazon Ads, Walmart Connect, Instacart Ads, Target Roundel); US retail media spend >$62B in 2025. EMARKETER+1
- Grocery & Quick Commerce: High-frequency, defensible LTV; Walmart leads US digital grocery share. EMARKETER
- Payments & Checkout: PayPal, Stripe, Adyen, BNPL (Affirm, Klarna) underpin conversion and AOV in value-seeking cycles. (Company filings and market coverage widely corroborate category roles.)
- Logistics & 3PL / Cross-border: UPS, FedEx, USPS; tech-enabled 3PLs (ShipBob, Flexport). Container rates normalized vs. pandemic peaks but remain volatile. Drewry+1
Macroeconomic forces affecting the sector
- Trade & compliance: The US suspension of duty-free de minimis (effective Aug 29, 2025) ends tariff-free treatment for sub-$800 parcels, increasing landed costs and customs friction for cross-border DTC shipments. Prioritize in-market inventory and compliant brokerage. The White House U.S. Customs and Border Protection+1
- Privacy & ad-tech: Google will maintain third-party cookies in Chrome (Apr 2025), slowing (not stopping) the shift to first-party data. Expect continued movement toward consented audiences and retail media. Privacy Sandbox Reuters
- Pricing & fee transparency: New FTC “Unfair or Deceptive Fees” rule (May 2025 effective) raises pressure for all-in pricing—relevant to fees in delivery, returns, and subscriptions. Federal Trade Commission+1
- Labor costs & availability: Real average hourly earnings rose ~1.2 – 1.3% YoY into July 2025; retail job openings ticked higher in latest JOLTS, keeping wage pressure in store and fulfillment roles. Bureau of Labor Statistics+1
- Logistics costs: Drewry World Container Index hovered near $2,100–$2,500 per FEU mid-to-late Aug 2025—well below pandemic highs but still sensitive to routing disruptions (e.g., Red Sea). AJOT Drewry
Competitive dynamics: consolidation vs. fragmentation
- Consolidation at the top: Amazon’s scale (≈40% US e-commerce share) and Walmart’s acceleration—especially in digital grocery—concentrate volume, data, and ad inventory, reinforcing network effects. EMARKETER+1
- Fragmented long tail: Despite dominance at the top, nearly half of US online sales remain beyond the leaders, leaving room for category specialists and DTC brands to carve out niches via assortment, community, and retail media arbitrage. EMARKETER
- Ecosystem gravity: Retail/commerce media’s growth consolidates budgets on platforms with the richest first-party purchase data (Amazon/Walmart), raising the bar for smaller RMNs. EMARKETER
Market map (major players by segment)
| Segment | Representative Leaders (linked) | Why They Matter | Reference |
|---|---|---|---|
| Marketplaces | Amazon · Walmart · eBay · Temu · SHEIN | Scale GMV, logistics, and retail media flywheels. | eMarketer (Amazon share) |
| Omnichannel Retailers | Walmart · Target · Costco · Kroger | Stores as fulfillment hubs; grocery leadership. | WSJ · eMarketer (digital grocery) |
| DTC Platforms & Enablement | Shopify · BigCommerce · Salesforce Commerce Cloud · Adobe Commerce | Merchant stack, app ecosystems, payments, OMS. | Shopify 10-K (2024 GMV) |
| Retail / Commerce Media | Amazon Ads · Walmart Connect · Instacart Ads · Target Roundel | Closed-loop attribution, high-intent audiences. | eMarketer (>$62B in 2025) |
| Payments & Checkout | PayPal · Stripe · Adyen · Klarna · Affirm | Authorization, alternative tender, BNPL conversion. | Company / filings |
| Logistics & 3PL | UPS · FedEx · USPS · ShipBob · Flexport | Fulfillment, last-mile speed, cross-border capacity. | Drewry WCI |
| Grocery & Q-commerce | Walmart · Amazon Fresh · Instacart · DoorDash | High-frequency baskets, defensible LTV. | eMarketer |
| Cross-border & Social Commerce | AliExpress · SHEIN · Temu · TikTok Shop | Traffic and price disruption; now facing higher US landed costs after de minimis suspension. | CBP FAQ (Aug 29, 2025) |
What this means for HOLD.co (market-structure lens)
- TAM is large and resilient (>$6.4T 2025), but growth and penetration gains vary by category and geography—with grocery and essentials keeping online frequency high and retail media concentrating power in scaled ecosystems. EMARKETER+2
- SAM selection matters. A North America–led focus (US run-rate ≈ $1.22T e-commerce) with exposure to grocery/consumables and platforms (Shopify app/enablement) offers better defensiveness through cycles. Census.gov Q4 Inc.
- Macro & policy are real P&L levers: US de minimis changes and FTC fee transparency rules affect cross-border unit economics and front-end pricing UX; both will reshape conversion and margins. U.S. Customs and Border Protection Federal Trade Commission
M&A Trends and Deal Activity — E-commerce / Retail (2024–2025)
Snapshot: Retail/E-commerce dealmaking re-accelerated through 2024 and into 2025, led by strategics pursuing scale and “beyond-trade” adjacencies (e.g., retail media), while private equity stayed active with bolt-ons amid a still-selective exit market. Retail valuations ticked up on the public side (especially for broadline “Retail – General”), but private middle-market purchase price multiples remained range-bound overall, with a clear size premium.
Meanwhile, regulators remain assertive—high-profile megadeals in grocery and luxury faced injunctions or were abandoned—pushing buyers toward tuck-ins, cross-border, and capability plays. Bain PwC Reuters
Activity levels & pricing (what moved)
- Retail M&A rebounded in 2024; momentum carrying into 2025. Bain reports retail deal value doubled in 2024, with median retail deal valuations rising from ~9x to ~10x EBITDA; strategics continue to pursue megadeals for scale and capability, even as diligence widens to antitrust. Bain
- Consumer markets deal value +32% YoY in H1’25 (volumes −9%)—driven by a handful of megadeals; strategics remain the most decisive buyers, while PE leans into bolt-ons and selective take-privates. PwC
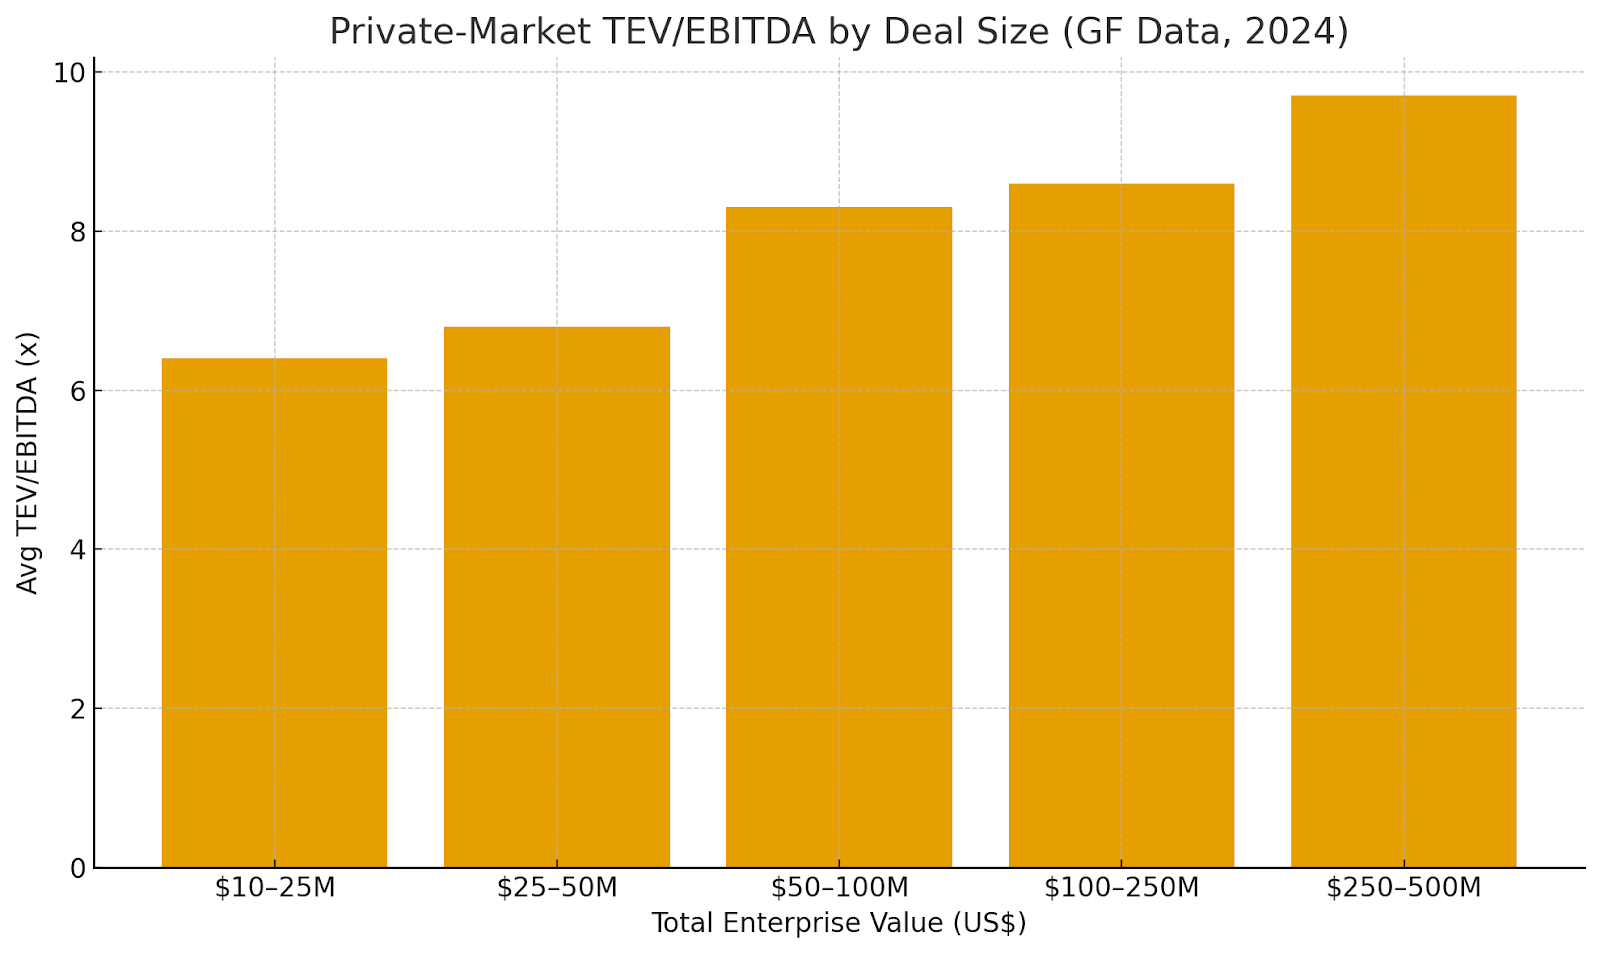
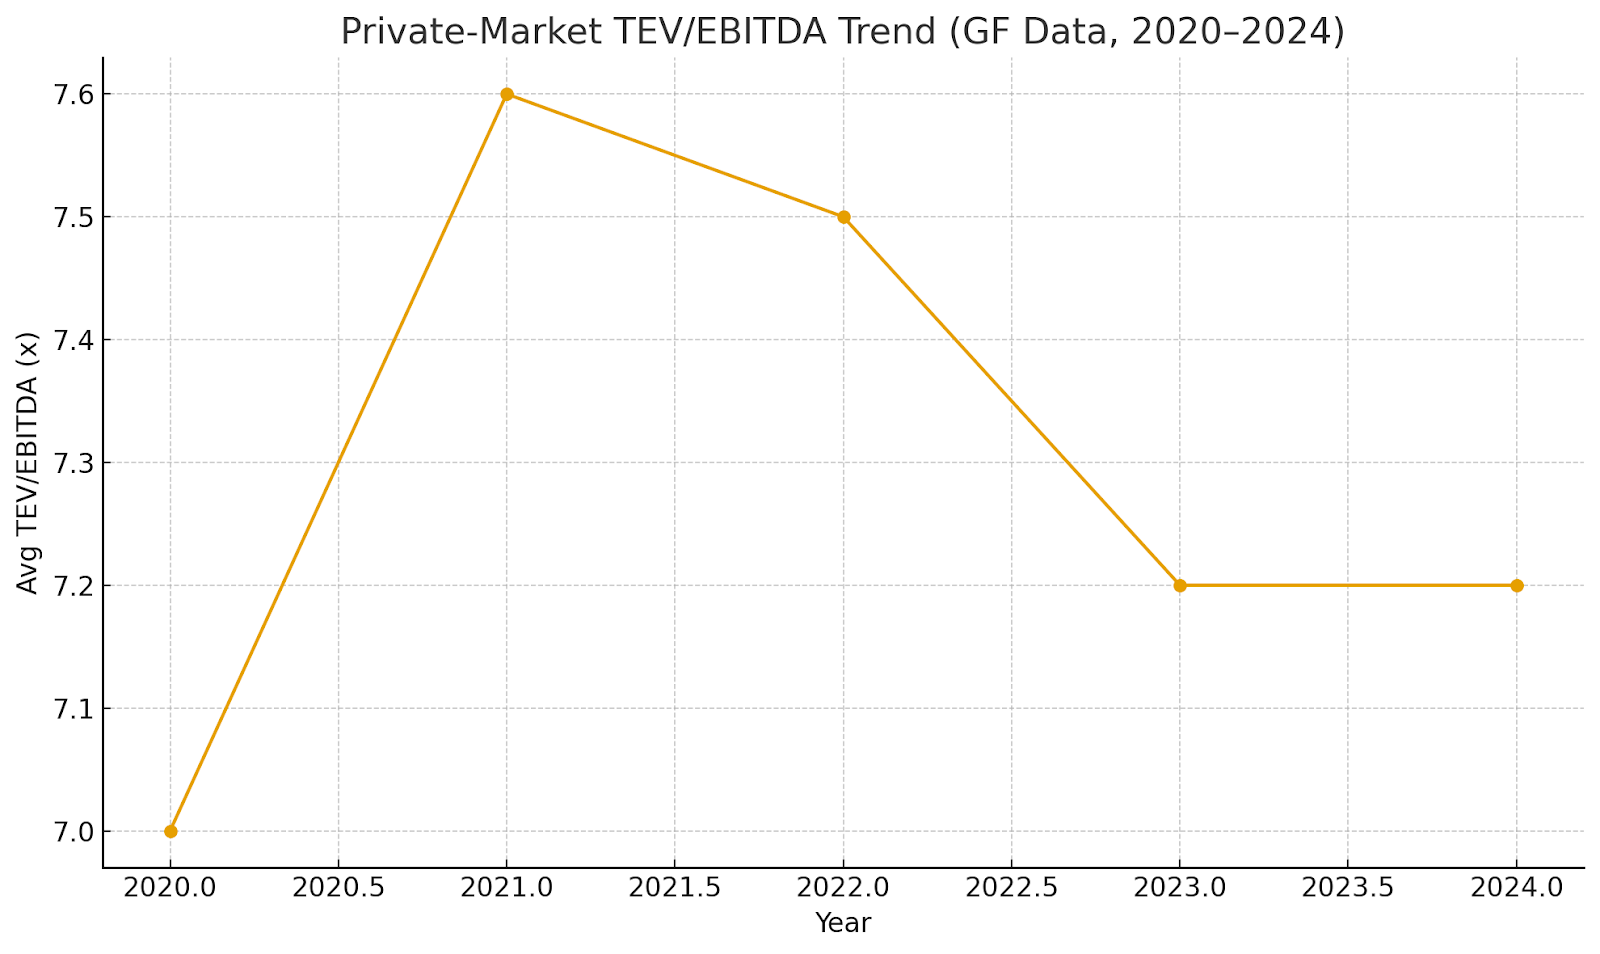
- Private middle-market EBITDA multiples steady overall. GF Data shows FY2024 average at 7.2x EBITDA (Q4: 7.3x), with a size premium from ~6.4x (TEV $10–25M) to ~9.7x (TEV $250–500M). Early Q2’25 read placed the all-industry average nearer 6.8x as conditions cooled. Middle Market Growth
- Public comps diverge by retail sub-segment. As of Jan 2025, Damodaran’s US datasets show median EV/EBITDA around 7.7x for Grocery, ~9.9x for Specialty, and ~18.2x for General Retail; EV/Sales spans ~0.36x (Grocery) to ~1.94x (General). Stern School of Business
- Regulatory posture: firm. The Kroger–Albertsons merger was blocked; Tapestry–Capri was enjoined and then terminated—signaling elevated antitrust risk for large, horizontal combinations. Reuters
Notable acquisitions (past 12–24 months) & quick comps
| Date | Acquirer → Target | Segment / Rationale | Deal Value | Disclosed Multiple / Premium | Source |
|---|---|---|---|---|---|
| Dec 2024 (closed) | Walmart → Vizio | Retail media adjacency (CTV/OS for ads) | US$2.3B | ~1.3x Price/Sales (equity value / TTM revenue)† | The Verge · CompaniesMarketCap · FT |
| Aug 2025 (ann.) | JD.com → CECONOMY (MediaMarktSaturn) | Cross-border scale in electronics retail | ~€2.2B equity value | ~23% premium to prior close | FT |
| Jan 2024 (closed) | TikTok (ByteDance) → Majority of Tokopedia | Indonesia marketplace re-entry & payments tie-up | ~US$840M | Regulatory conditions clarified June 2025 | Reuters (Jun 2025) · Reuters (Jan 2024) |
| Feb 2024 (closed) | Coupang → Farfetch assets | Luxury e-commerce rescue / marketplace capability | US$500M | n/a | Coupang IR · Digital Commerce 360 |
| Mar 2024 → Feb 2025 (follow-on) | ALDI → Southeastern Grocers (Winn-Dixie/Harveys) | Footprint expansion; later divested ~170 stores | Undisclosed | ~220 conversions planned by 2027 | Supermarket News · Winn-Dixie PR (Feb 2025) |
| Aug 2025 (ann.) | Frasers Group → eBuyer | Online tech retail (UK) roll-up | Undisclosed | n/a | Reuters |
| Terminated 2024–2025 | Kroger–Albertsons; Tapestry–Capri | Megadeals blocked amid antitrust scrutiny | — | Prelim. injunctions; deals abandoned | FTC (Kroger–Albertsons) · Reuters (Tapestry–Capri) |
† Uses publicly reported TTM revenue for Vizio; shown as equity value / sales for comparability where net debt not disclosed in press materials.
Context for two bellwethers:
- Walmart→Vizio strengthens retail-media economics and data addressability (CTV screens + Platform+), illustrating “scope” M&A beyond core retail. The Verge Yahoo Finance
- JD.com→CECONOMY shows cross-border consolidation in electronics retail, with a premium offer amid European fragmentation.
Private equity vs. strategic buyer activity
- Strategics: Most active in 2024–2025 with scale and capability theses (e.g., CTV/retail media, last-mile, marketplace tech). Bain highlights a durable rebound with buyers widening antitrust, commercial, and operational diligence scopes; megadeals will persist where feasible. Bain
- Private equity: Maintains deal tempo via bolt-ons and take-privates, but exits remain selective; valuation gaps and rate uncertainty keep underwriting disciplined. PwC’s mid-year 2025 consumer outlook underscores the cautious stance even as deal values rose. PwC
- Pricing: Middle-market TEV/EBITDA medians clustered ~7x, with size premium back half 2024; early 2025 datapoints show a modest step down (~6.8x) before improving financing conditions later in 2025. Middle Market Growth
Valuation benchmarks
A) Private-market benchmarks by size (GF Data, FY2024)
| TEV Range (US$M) | Avg TEV/EBITDA (x) | Source |
|---|---|---|
| 10–25 | 6.4x | GF Data Q4’24 Highlights |
| 25–50 | 6.8x | GF Data |
| 50–100 | 8.3x | GF Data |
| 100–250 | 8.6x | GF Data |
| 250–500 | 9.7x | GF Data |
Private-Market TEV/EBITDA by Deal Size (GF Data, 2024) — rendered above.
B) Public vs. private comparables (as of Jan 2025 unless noted)
| TEV Range (US$M) | Avg TEV/EBITDA (x) | Source |
|---|---|---|
| 10–25 | 6.4x | GF Data Q4’24 Highlights |
| 25–50 | 6.8x | GF Data |
| 50–100 | 8.3x | GF Data |
| 100–250 | 8.6x | GF Data |
| 250–500 | 9.7x | GF Data |
Public vs private: how to read the gap
- Public–private spread: Public “Retail – General” (broadline & big-box) trades at a premium EV/EBITDA vs. private middle-market averages, reflecting scale, mix (retail media), and lower capital costs. Specialty and grocery medians align more closely with private prints. Stern School of Business+1 Middle Market Growth
- Company size matters: Every step up in TEV adds roughly 0.3–1.1x to median EBITDA multiples in 2024 (10–25M → 250–500M), reinforcing buy-and-build logic to capture re-rating on scale. Middle Market Growth
Private-market TEV/EBITDA trend (2020–2024);
Public EV/EBITDA by retail segment (Grocery, Specialty, General).
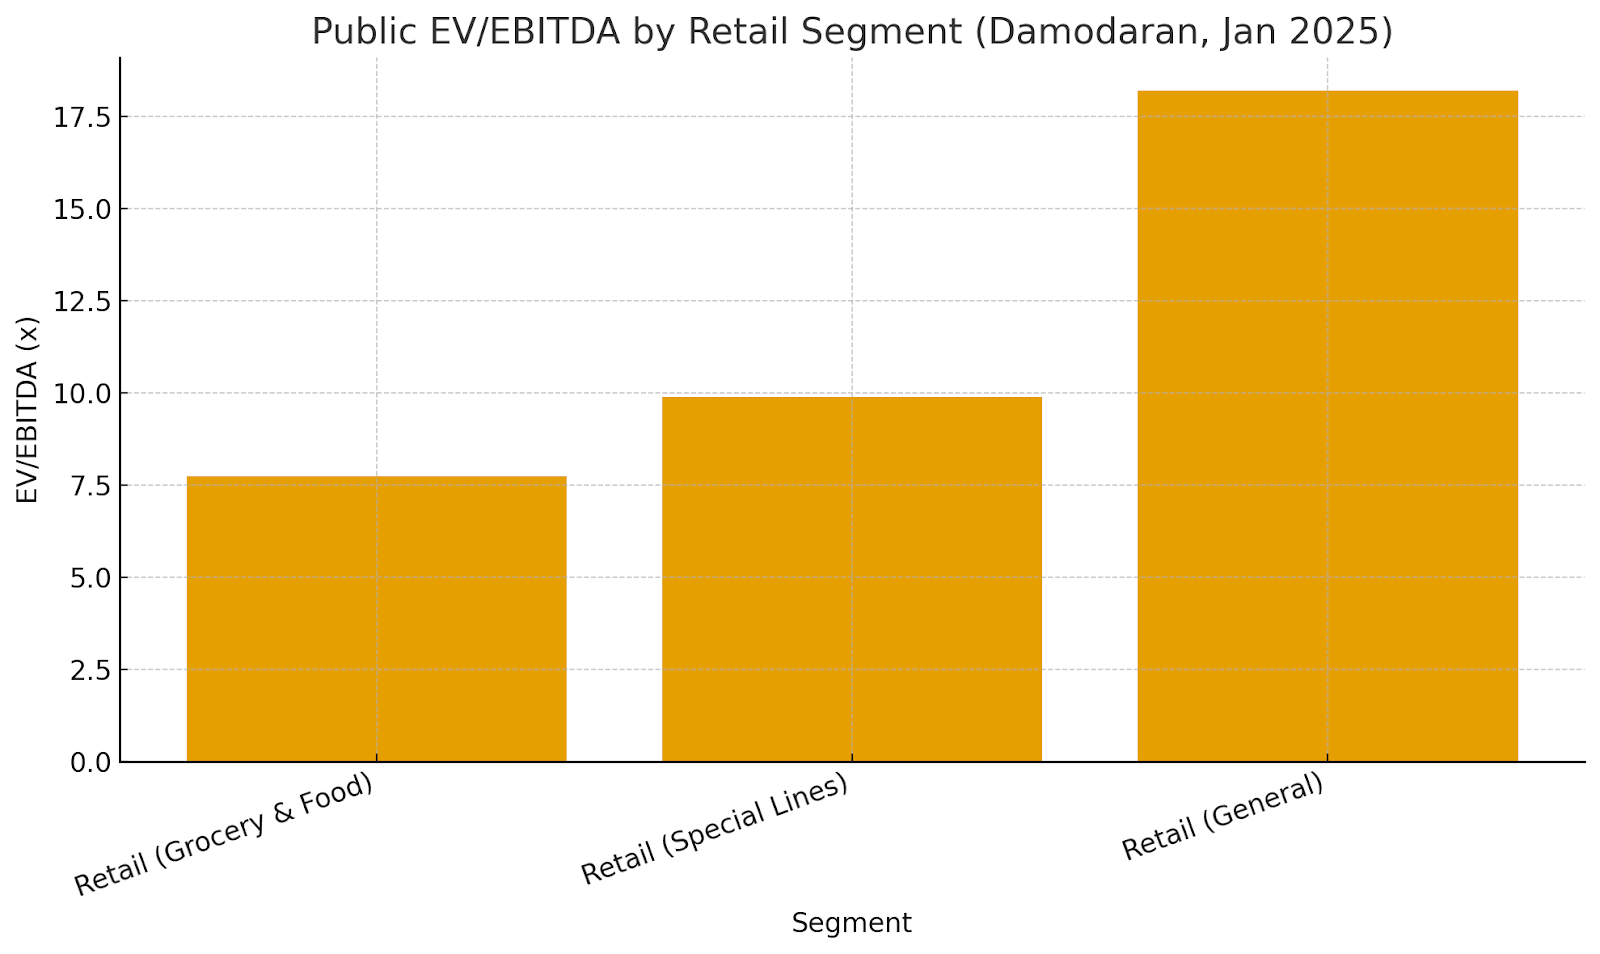
Sources: GF Data (Q4’24 highlights); Damodaran datasets (Jan 2025). Middle Market Growth Stern School of Business+1
Regulatory temperature check (deal feasibility)
- Grocery consolidation: Courts granted initial injunctions against Kroger–Albertsons, signaling high bar for same-market store overlaps; expect divestiture-heavy remedies if attempted.
- Fashion/luxury: Tapestry–Capri termination post-injunction highlights focus on category concentration (“affordable luxury”). Cross-category or capability deals face less friction than head-to-head combinations. Reuters+1
What this means for HOLD.co’s M&A lens (M&A-only implications)
- Prioritize capability adjacencies (CTV/retail media, marketplace enablement, last-mile/OMS, first-party data tooling) similar to Walmart–Vizio and Coupang–Farfetch asset pickup; lower antitrust risk and clearer synergy capture. The Verge Reuters
- For roll-ups, sequence add-ons to move up the size curve toward the 8–10x TEV/EBITDA range, where re-rating historically appears in private prints. Use public medians for ceiling checks on exit. Middle Market Growth Stern School of Business
- Expect longer sign-to-close on large horizontal combinations; build antitrust analytics and remedy plans into pre-LOI workstreams. Bain
Sources cited in this section
- Bain, M&A in Retail 2025: A Rebound—and No Sign of Letting Up (Feb 4, 2025). Bain
- PwC, Global M&A trends in consumer markets: 2025 mid-year outlook (Jun 24, 2025). PwC
- GF Data, Q4 2024 Highlights (Apr 2025) + ACG update for Q2 2025. Middle Market Growth
- Damodaran (NYU), EV/EBITDA & EV/Sales by sector (Jan 2025). Stern School of Business+1
- Deal comps: Walmart–Vizio (The Verge; FT; Vizio rev), JD.com–CECONOMY (FT), TikTok–Tokopedia (Reuters), Coupang–Farfetch (Coupang IR; Digital Commerce 360), ALDI–SEG (Supermarket News; Winn-Dixie PR), Kroger–Albertsons (FTC), Tapestry–Capri (Reuters). The Verge Companies Market Cap Reuters+1 Supermarket News Winn-Dixie
Technology & Innovation Trends — E-commerce / Retail (2024–2025)
Snapshot. Retail tech is in a scale-up phase: AI is moving from pilots to rewiring workflows; store-enabled fulfillment (BOPIS/curbside) has become a structural demand driver; RFID and the shift to 2D/QR barcodes are raising inventory visibility; and robotics adoption in supply chains is accelerating. At the same time, retail remains a top target for cyber actors, and PCI DSS 4.0 deadlines in 2025 have raised the bar for security and observability requirements. McKinsey & Company Capital One Shopping Accenture GS1 US mmh.com
State of digitization & software adoption
- Omnichannel enablement is mainstream. U.S. click-and-collect (BOPIS) reached $132.8B in 2024 (~9.9% of e-commerce) and is projected to grow ~16.7% CAGR through 2030; during peak 2024 holidays, curbside hit 17.5% of online orders (37% on Dec 23). Capital One Shopping Shopify
- In-store digital features: Among the Digital Commerce 360 Top 1000, 65.5% show in-store stock status online; 24.8% offer curbside pickup. atlasRFIDstore
- RFID is standard infrastructure. Accenture’s global study found ~93% of North American retailers use RFID (2020 study widely cited through 2024–25), underpinning inventory accuracy and omnichannel execution. Accenture
- 2D barcodes by 2027 (GS1 “Sunrise 2027”). Retail POS systems are expected to scan GS1-powered 2D codes by end-2027; during transition, products often carry both 1D and 2D codes. GS1 US GS1 Reference
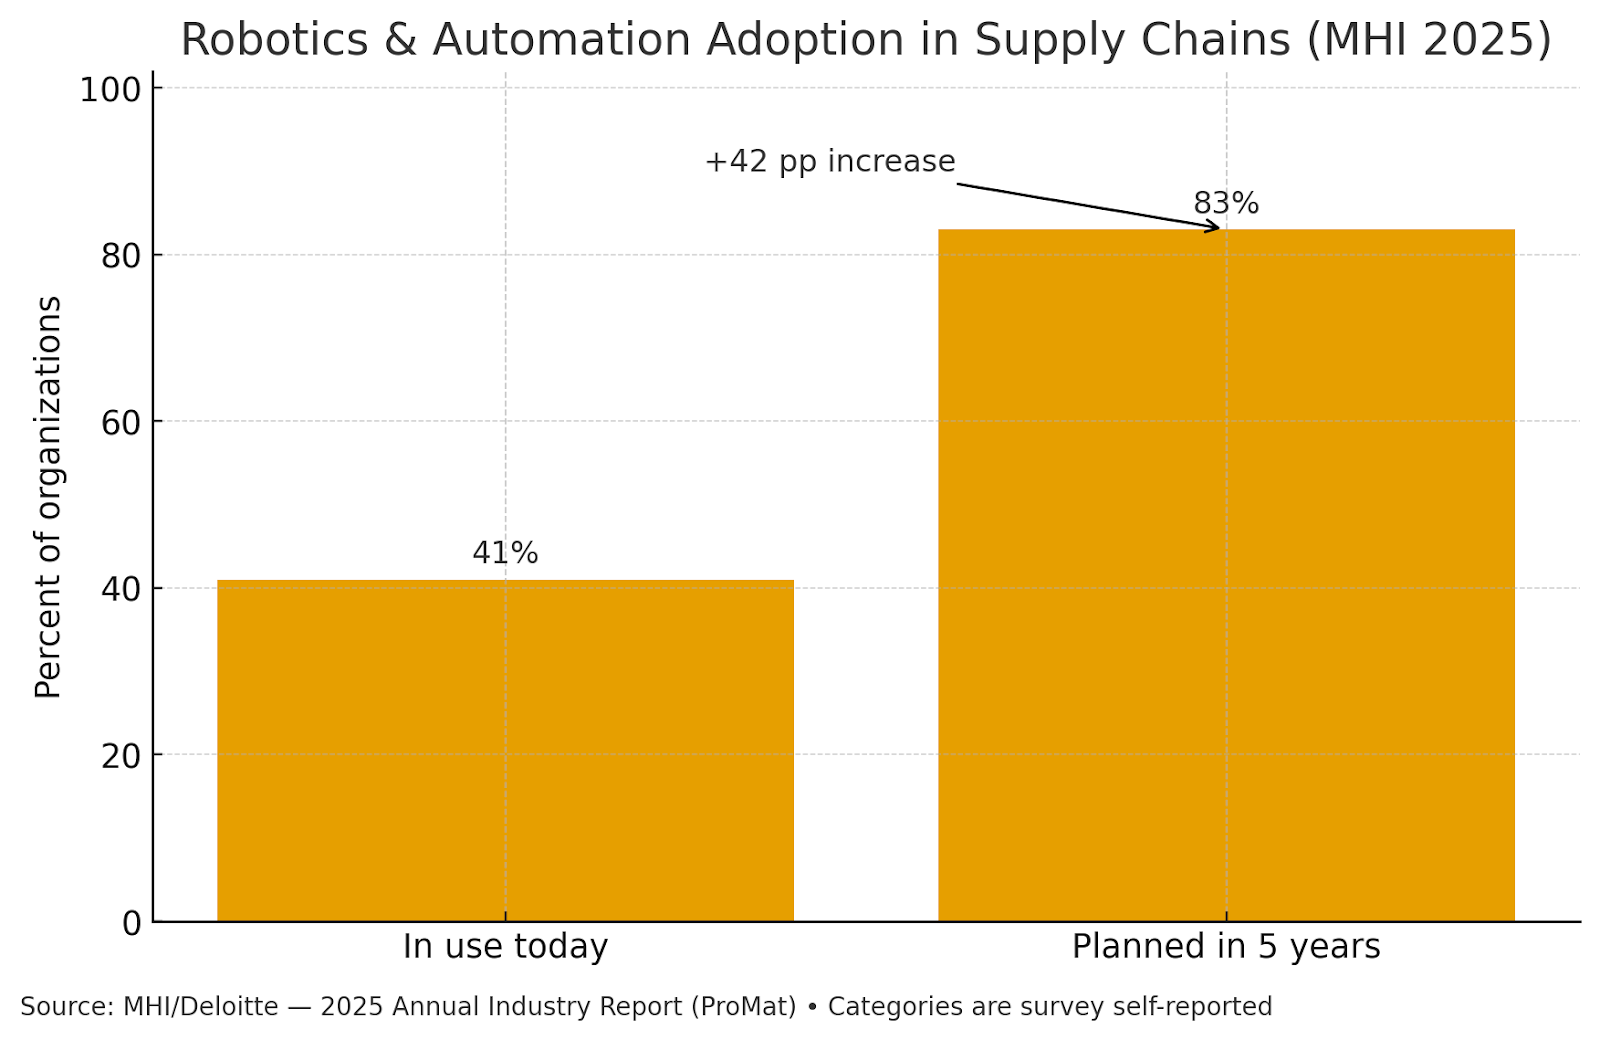
- Warehouse robotics adoption: 41% of supply-chain orgs report robotics/automation in use today, rising to ~83% within five years (MHI/Deloitte 2025). mmh.com
Robotics & automation adoption (now → 5 years):
Emerging technologies reshaping the space
Artificial Intelligence (incl. GenAI)
McKinsey estimates $240–$390B in value creation for retail from GenAI (≈ +1.2–1.9pp margin uplift) via smarter merchandising, marketing, service, and supply-chain use cases. McKinsey & Company
2025 McKinsey survey evidence: organizations report increasing revenue impact where workflows were redesigned around GenAI (not just tools layered on top). McKinsey & Company
IoT / Computer Vision
Widespread RFID supports accurate inventory, loss prevention, and faster cycle counts; mandates by large retailers have broadened tagging to additional categories. Accenture Impinj
Autonomous/vision checkout is consolidating to formats with better unit economics: Amazon removed Just Walk Out from U.S. Fresh stores in favor of smart carts, while continuing third-party/small-format JWO deployments. Retail Dive About Amazon
Data Standards, Provenance & Compliance Tech
The EU’s Ecodesign for Sustainable Products Regulation introduces Digital Product Passports, pushing retailers/brands to collect and share standardized product data—often implemented with 2D codes and, in some programs, distributed ledgers. Macrotrends
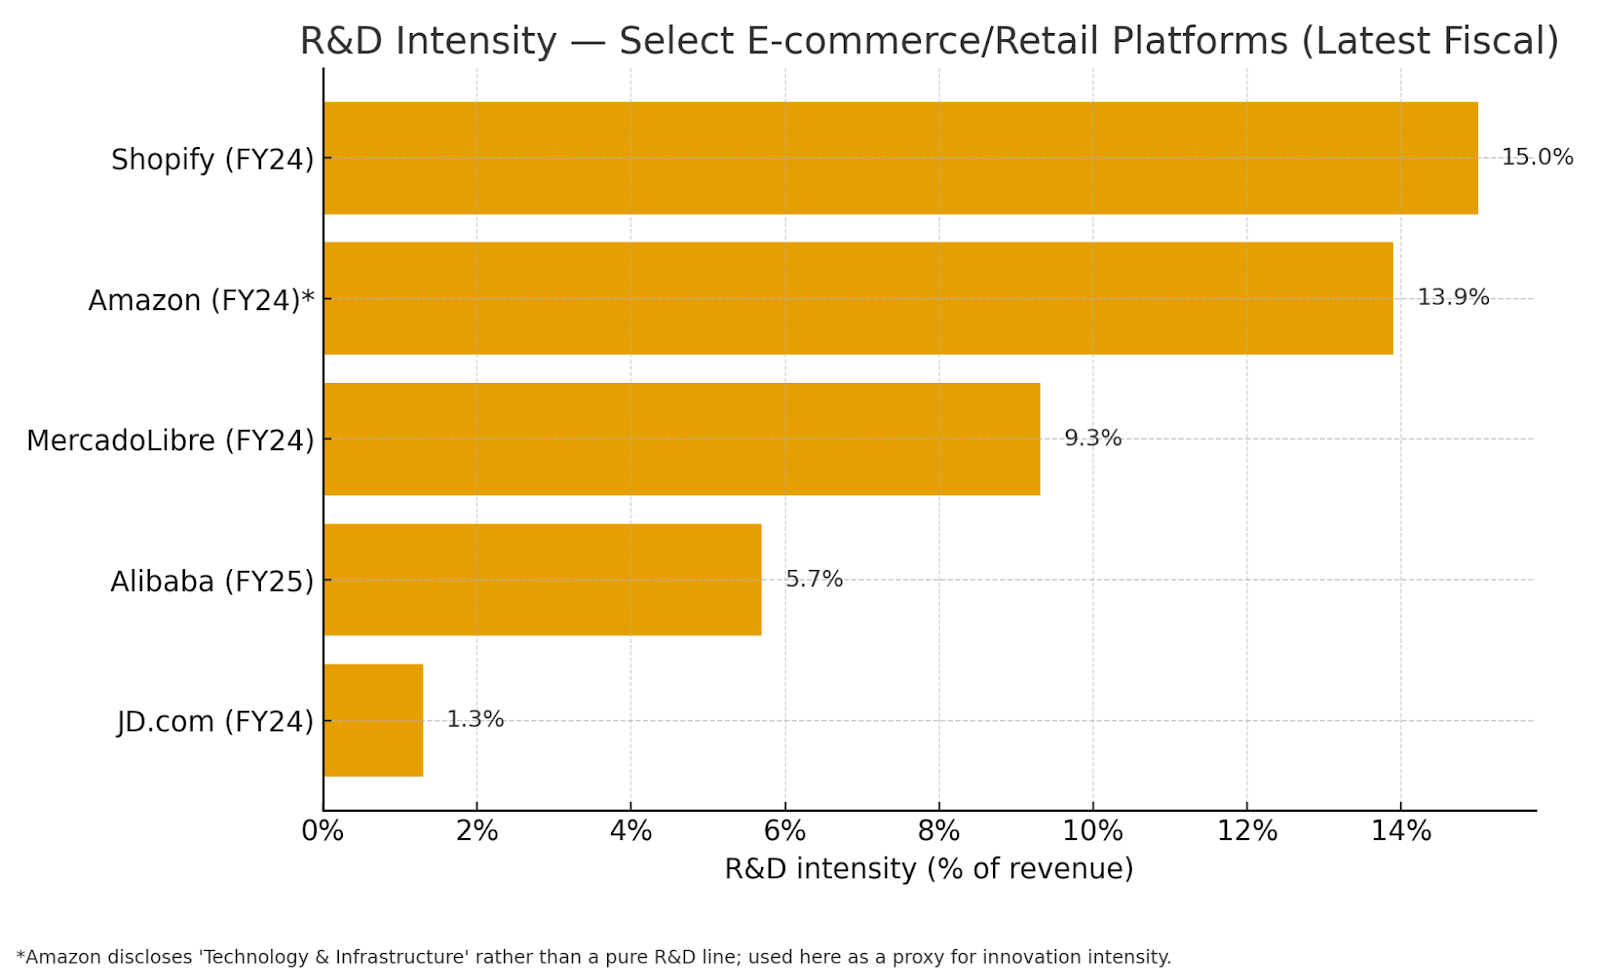
R&D spend benchmarks (platforms & large e-retailers)
Chart — R&D intensity (% of revenue, latest fiscal):
Cybersecurity & infrastructure risks
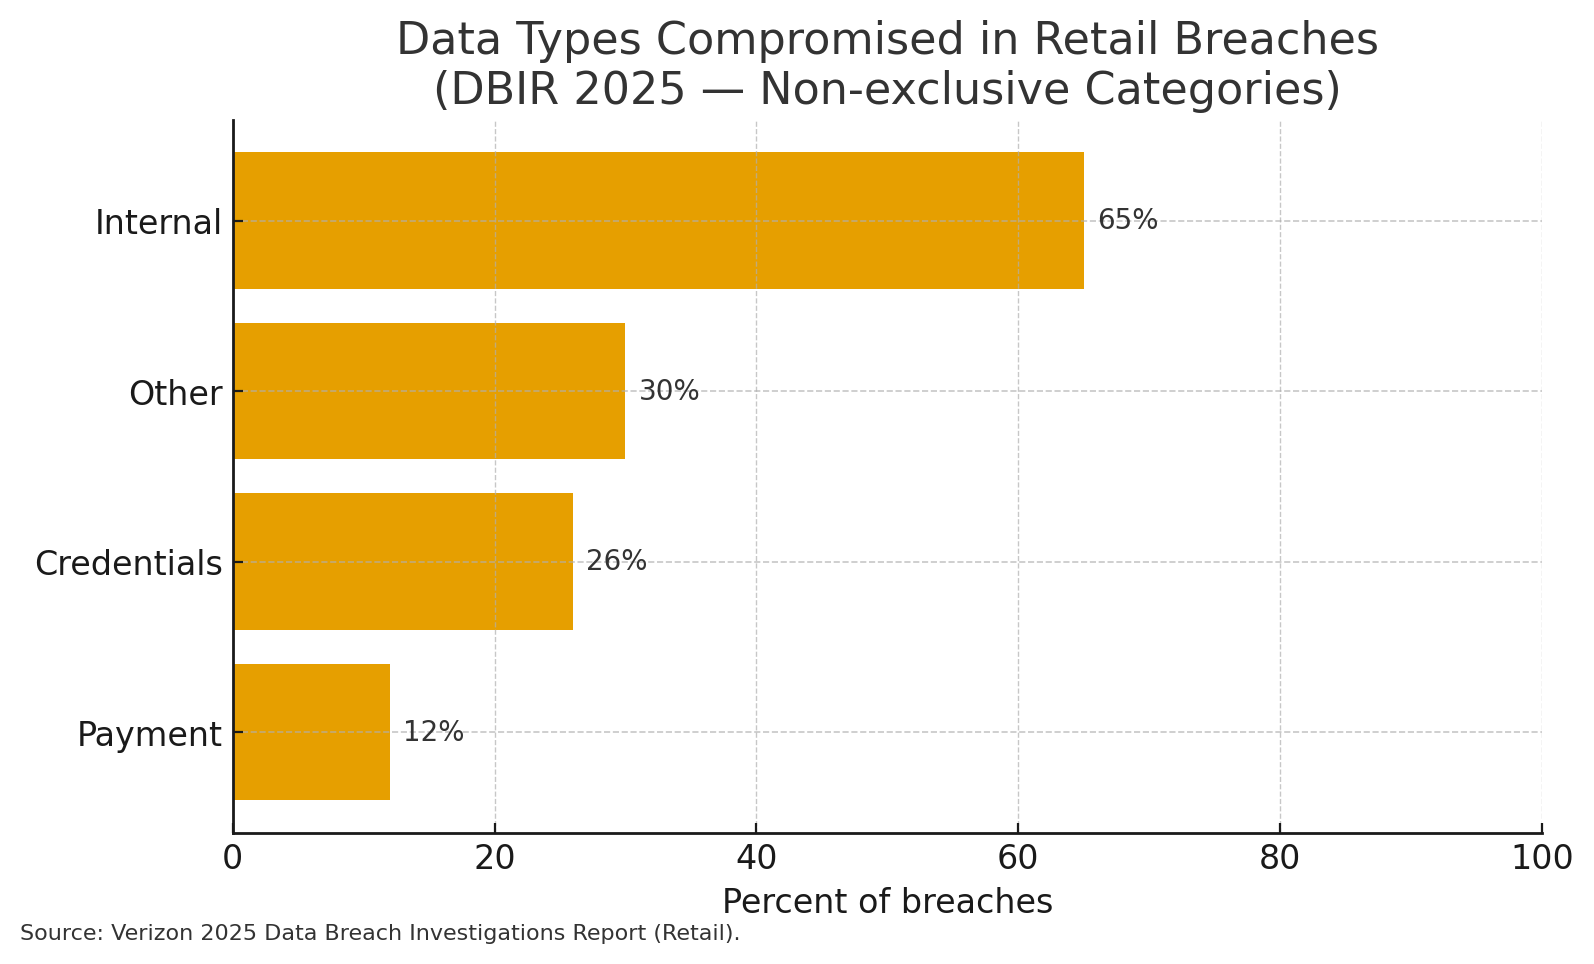
What the data shows (Verizon DBIR 2025, Retail):
- 837 incidents in retail, 419 with confirmed data disclosure; System Intrusion, Social Engineering, and Basic Web Application Attacks account for 93% of breaches. Attackers are 96% external. Most-compromised data types include internal (65%), credentials (26%), and payment data (12%).
- Exploitation of vulnerabilities is rising as an initial access vector; ransomware remains prevalent across industries. Third-party involvement doubled (15%→30%) YoY. Patch windows are tightening (median ~32 days to remediate edge device vulns in the dataset).
- PCI DSS v4.x: future-dated controls became mandatory by Mar 31/Apr 1, 2025—including stronger auth, vulnerability management, and software inventories—raising compliance and tooling requirements for merchants and service providers. PCI Perspectives Cloud Security Alliance
Chart — Data types compromised in retail breaches (non-exclusive):
Risk benchmarks & required controls
| Risk / Pattern | What’s happening | Control priorities | Reference |
|---|---|---|---|
| System Intrusion & BEC/Social | 93% of retail breaches fall into 3 patterns; 96% involve external actors. | Phishing-resistant MFA, FIDO2; least-privilege; mailbox rules hardening; EDR + identity threat detection. | Verizon DBIR 2025 |
| Credential & payment data exposure | Retail breaches often expose internal (65%), credentials (26%), and payment data (12%). | WAF + bot mgmt; web/app hardening; vault secrets; network tokenization. | Verizon DBIR 2025 |
| Patch debt & edge vulns | Shorter remediation windows; increased exploitation of known vulns. | SBOMs; risk-based patching SLAs; continuous scanning. | Verizon DBIR 2025 |
| PCI DSS v4.x enforcement | Future-dated controls now mandatory (Mar/Apr 2025); v4.0.1 active. | Phishing-resistant auth, stronger vulnerability mgmt, software inventories. | PCI SSC | CSA |
Build vs. buy opportunities for tech innovation
Principle. Favor a composable architecture (API-first, headless/MACH) so acquired brands can share core capabilities (identity, OMS, search) while preserving front-end differentiation. Gartner-cited forecasts expect majority adoption of composable commerce by 2027. IDC
Decision matrix
| Capability | When to BUILD | When to BUY | Integration notes | Reference |
|---|---|---|---|---|
| Search, Browse & Merchandising (incl. AI rerank) | Unique domain logic (rules, embeds) and proprietary signals materially drive CVR/AOV. | Need fast time-to-value, multi-store support, and OOTB AI; limited search team. | Expose as API shared service; stream click & order events for model training. | MACH/Composable rationale |
| Order Management (OMS) & BOPIS orchestration | Highly bespoke SFS/BOPIS, slotting, store ops tightly coupled to legacy systems. | Standard SFS/BOPIS rules, inventory reservations, store handoff. | Unified inventory service; POS/ERP adapters; store-ops app for picking. | DC360 omni data |
| Product Data (PIM/PXM) & 2D barcode readiness | Complex configurable products; regulated attributes; in-house taxonomy wins. | Need quick GS1/2D compliance, channel syndication, DPP prep. | Adopt GS1 Digital Link; maintain golden record; auto-generate labels/QR. | GS1 Sunrise 2027 |
| Personalization & Marketing AI | You own large first-party graph and want custom LLMs/agents. | Early maturity; prefer packaged journeys, uplift models. | Privacy zone; batch & real-time features; guardrails for GenAI. | McKinsey GenAI in retail |
| Warehouse automation & robotics | High SKU/throughput uniqueness; multi-tenant DCs; custom slotting algorithms. | Standard AMRs/ASRS; predictable footprints; proven vendor SLAs. | Event bus for WMS/OMS; digital twin for layout testing. | MHI 2025 |
| Security & Compliance Tooling (PCI v4) | Custom high-risk workflows, proprietary payment flows. | To meet v4 controls faster (MFA, SBOMs, vulns mgmt), leverage proven SaaS. | Central identity; WAF/bot mgmt; SBOM inventory. | PCI SSC |
Technology adoption & impact benchmarks (quick-scan)
Selected 2024–2025 benchmarks
| Capability | Adoption / Scale | Observed/Projected Impact | Source |
|---|---|---|---|
| GenAI in Retail | Broader deployment with workflow redesign in 2025. | $240–$390B value; +1.2–1.9pp margin potential. | McKinsey | State of AI 2025 |
| RFID in Retail | ~93% of N. American retailers using RFID. | Higher inventory accuracy; supports BOPIS/ship-from-store. | Accenture RFID |
| BOPIS / Click-and-Collect | $132.8B in 2024 (9.93% of e-com); holiday curbside up to 37% of orders (Dec 23). | Basket-size & loyalty lift; ops cost trade-offs. | Capital One Shopping | Shopify Enterprise |
| 2D Barcodes (GS1 Sunrise 2027) | POS scanners expected to read 2D codes by 2027; dual-code transition. | Deeper product data, recalls, DPP compliance, engagement. | GS1 US | GS1 Guidelines |
| Robotics/Automation (Supply Chain) | 41% in use today; ~83% expected within 5 years. | Throughput gains; labor elasticity; shorter cycle times. | MHI 2025 |
| Vision/Autonomous Checkout | Amazon removed JWO from U.S. Fresh (pivot to smart carts); JWO expands via third-party/small formats. | Signals focus on unit economics and shopper transparency. | Retail Dive | Amazon update |
Analyst takeaways for HOLD.co (technology lens)
- Lean into composable shared services (inventory, OMS, search/personalization) across portfolio brands; this speeds rollout of BOPIS/curbside and reduces duplicate capex while complying with GS1 Sunrise 2027 data flows. GS1 US
- Prioritize AI where data moats exist (first-party events, product/returns history) and tie initiatives to margin KPIs; McKinsey’s value range implies that 100–200 bps EBIT improvements are realistic with workflow redesign, not tool overlays. McKinsey & Company
- Security first: align roadmaps to PCI DSS v4.x controls (MFA, SBOM-driven vuln mgmt) and DBIR-evidenced attack patterns; treat this as both risk reduction and enabler for faster payment/checkout innovation. PCI Perspectives
- Automate the back-of-house: robotics adoption is a consensus trend; deploy in brownfield sites with digital-twin pilots and unified eventing to OMS/WMS for measurable throughput and SLA gains. mmh.com
Operations & Supply Chain Landscape — E-commerce / Retail
Typical cost structure (COGS, SG&A, labor, logistics)
Sector-level snapshot (US, Jan 2025): Retail categories run high COGS with lean operating margins; SG&A (incl. store ops, fulfillment, support, and ads) typically spans ~20–25% of sales. Benchmarks below are aggregated from public company financials in each sub-industry.
Cost structure & margin benchmarks (US, Jan 2025)
| Segment | COGS (% of Sales) | SG&A (% of Sales) | Operating Margin (pre-tax) | Source |
|---|---|---|---|---|
| Retail (General) | 67.78% | 21.07% | 6.20% | Damodaran (Jan 2025) |
| Retail (Grocery & Food) | 73.91% | 20.50% | 3.33% | Damodaran (Jan 2025) |
| Retail (Special Lines) | 69.61% | 24.79% | 5.10% | Damodaran (Jan 2025) |
| Case study: Amazon (2024) | — | — | — |
Fulfillment $98.5B; Shipping $95.8B; Net sales $638.0B Amazon 10-K 2024 |
Notes: Amazon’s fulfillment and shipping spend equate to ~15.4% and 15.0% of 2024 net sales, respectively (calculated from disclosed totals).
Notes: Amazon’s fulfillment and shipping spend equate to ~15.4% and 15.0% of 2024 net sales, respectively (calculated from disclosed totals).
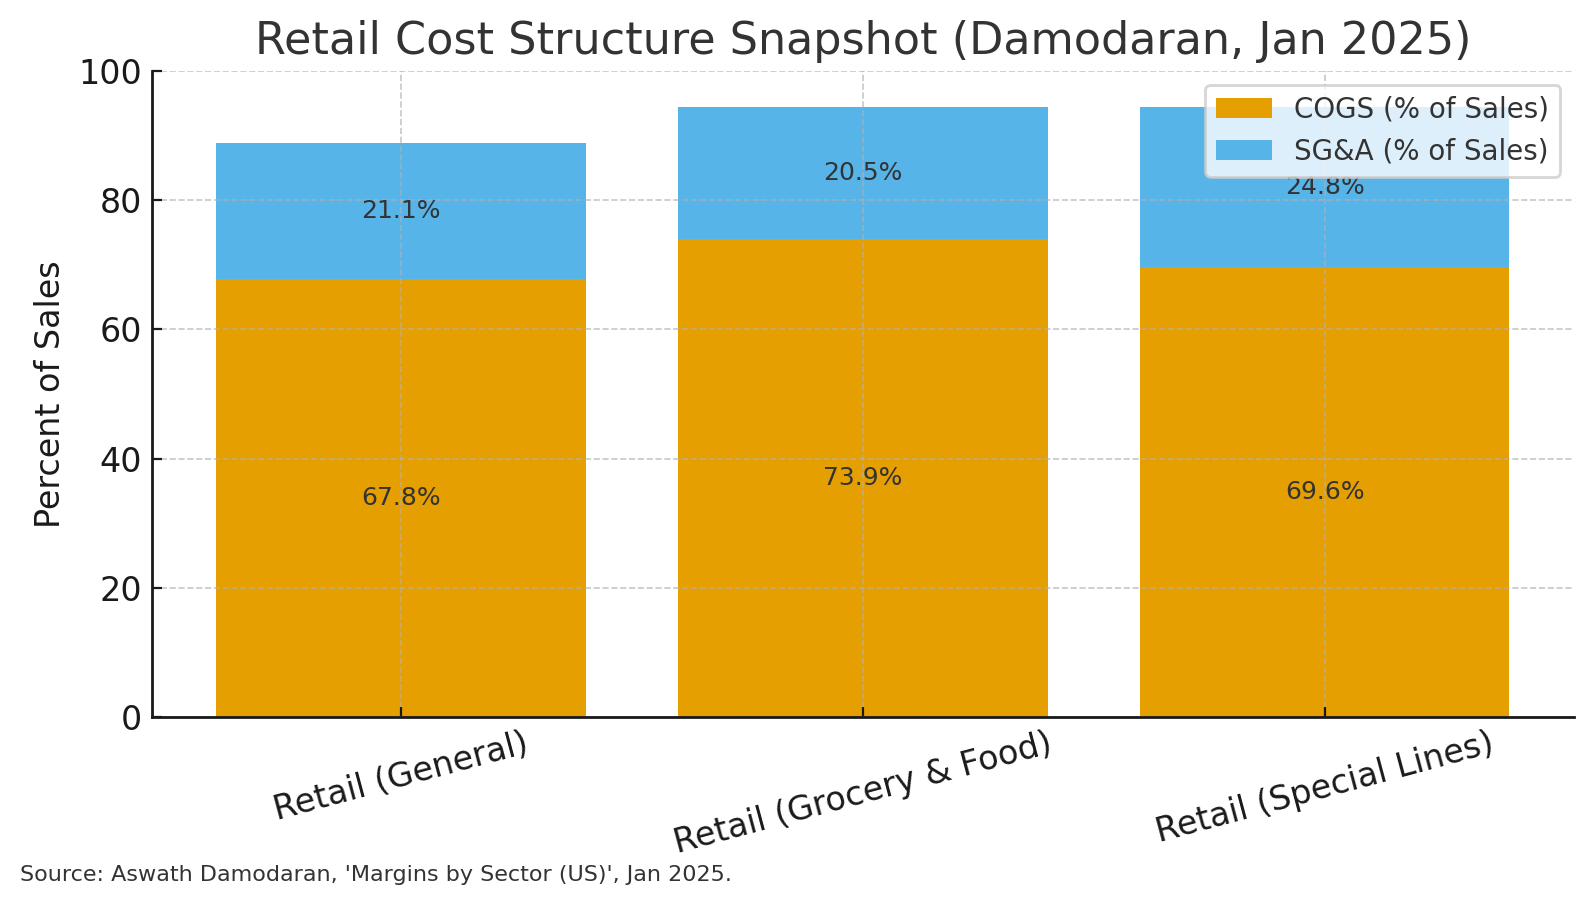
Cost structure snapshot across retail segments
Source: Damodaran (Jan 2025).
Supply-chain vulnerabilities & strengths
Vulnerabilities
- Last-mile cost inflation & variability. Last mile remains the single costliest leg, estimated around ~41% of logistics costs, sensitive to density, failed-delivery rates, and peak surcharges. Business Insider Radial
- Ocean freight volatility. Container spot rates have swung materially since 2024; Drewry’s WCI stood at $2,119/FEU on Aug 28, 2025, down from earlier summer spikes tied to tariffs/geopolitical routing.
- Parcel GRIs & peak fees. UPS & FedEx 2025 GRIs: +5.9% on average; carriers add seasonal surcharges, pressuring unit economics.
- Reverse-logistics drag. Returns projected at $890B (16.9% of 2024 sales), with fraud/abuse cited by 93% of retailers—material throughput and margin headwinds.
- Tariff exposure. Retailers face input-cost pressure and price hike risks on non-food imports (apparel, electronics), as highlighted by Walmart’s guidance on tariff pass-through. The Washington Post
Strengths
- Network speed & reliability improving. Peak-season 2024 delivery times ran ~3.7 days (Nov) and ~4.8 days (Dec), an improvement vs prior years; shippers also spread risk across ~6 carriers on average.
- Automation momentum. Industry surveys project 83% adoption of robotics/automation within five years; workforce upskilling + automation is the dominant resilience strategy. Business Wire
- Scale effects in big-box & marketplaces. Leaders (e.g., Amazon) continue to bend unit costs via dense sortation/last-mile networks and rising ad/third-party services to subsidize fulfillment.
Labor force trends (shortages, automation, outsourcing)
- Wage baseline: Avg hourly earnings (Jul 2025) — Retail trade: $25.71; Transportation & Warehousing: $30.17. Real wages up ~1.2–1.3% YoY in mid-2025.
- Openings: Retail job openings +190k in June 2025, indicating persistent staffing tightness for store ops, warehousing, and delivery partners. Bureau of Labor Statistics
- Top operator challenge: Workforce availability/retention again ranks #1 in MHI’s 2025 industry survey, propelling automation roadmaps (AI, robotics, goods-to-person). MHI Solutions
- Implication: Expect continued automation + flexible staffing models (3PLs, on-demand couriers) and training investments to stabilize throughput without oversizing fixed payroll.
Benchmark data: margins, throughput, cycle times, logistics costs
Operations KPIs & supply-chain benchmarks (2024–2025)
| KPI | Benchmark (latest) | Context | Source |
|---|---|---|---|
| Last-mile share of logistics cost | ~41% | Most expensive leg; sensitive to density & failure rates | Business Insider (Jul 2025), Radial (2024) |
| Avg delivery time (peak 2024) | 3.7 days (Nov); 4.8 days (Dec) | Improved vs 2023; still seasonal spikes | project44 (Dec 2024), project44 (Feb 2025) |
| Consumer definition of “fast shipping” | ~3.1 days (2024) | Expectation baseline for non-grocery | Pitney Bowes BOXpoll (Mar 2024) |
| U.S. parcel volume (2024) | 22.37B shipments | +3.4% YoY; revenue growth slower than volume | Pitney Bowes Parcel Shipping Index (2025) |
| Returns rate (all retail, 2024) | 16.9% of sales (~$890B) | Peak season adds +17% vs annual baseline | NRF/Happy Returns (Dec 2024) |
| Carrier GRIs (2025) | UPS & FedEx: +5.9% avg | Plus recurring holiday surcharges | ParcelIndustry (UPS), FedEx (rates) |
| Ocean container spot (WCI) | $2,119/FEU (Aug 28, 2025) | Volatile on tariffs & routing | Drewry WCI |
| Labor cost baseline (Jul 2025) | Retail: $25.71/hr; Transp/Warehousing: $30.17/hr | Real wages up ~1.2–1.3% YoY (mid-2025) | FRED/BLS (Retail), BLS (Transp/Warehousing), DOL Real Earnings |
| Automation adoption outlook | Robotics/automation: 83% predicted adoption (5 yrs) | Investment focus for resilience & labor gaps | MHI & Deloitte (Mar 2025) |
| Amazon fulfillment & shipping intensity (2024) | Fulfillment: ~15.4% of net sales; Shipping: ~15.0% | Illustrative scale economics vs sector | Amazon 10-K 2024 |
Interpretation: The cost stack leaves little room for error—last-mile, returns, and peak surcharges are the three most actionable levers to protect contribution margins. Faster delivery is becoming achievable (network and carrier improvements), but price discipline and automation are crucial to hold operating margins above ~5–6% in general retail. Business Wire
Strategic operations implications (for HOLD.co)
- Centralize carrier procurement & diversify mix. Negotiate against 2025 GRIs and peak surcharges; target multi-carrier (≈6 carriers) setups to arbitrage lanes and reduce failure risk.
- Engineer last-mile density. Consolidate drop density (micro-hubs, pickup/return points) and optimize delivery promise windows to chip away at the ~41% last-mile cost share. Business Insider Radial
- Design for reverse-logistics. Standardize “no-box/no-label” flows, centralize refurbishment/resale, and use fraud screening—returns are an $890B drag and a major margin lever.
- Automate fulfillment nodes. Prioritize robotics, WES/WMS upgrades and goods-to-person in facilities with labor tightness; aligns with 83% adoption trajectory and workforce constraints highlighted by MHI. Business Wire MHI Solutions
- Hedge ocean volatility. Blend index-linked contracts (e.g., to WCI) with time-charter/capacity agreements; revisit Asia-to-US routings as rates fluctuate.
- Track margin “tripwires.” Monitor: cost-to-deliver per order (esp. surcharges), returns rate by SKU cohort, labor CPLH (cost per labor hour), and promised-vs-actual delivery time deltas—each ties directly to the benchmarks above.
Sources (key citations)
- Damodaran sector margins (Jan 2025).
- Amazon 2024 Form 10-K (fulfillment, shipping, net sales).
- MHI & Deloitte Annual Industry Report 2025 (automation outlook; workforce). Business Wire MHI Solutions
- NRF/Happy Returns 2024 returns study.
- Business Insider last-mile cost overview (2025). Business Insider
- Radial last-mile cost context. Radial
- Drewry World Container Index (2025).
- UPS/FedEx 2025 GRIs; USPS/FedEx peak surcharges context.
- project44 peak-season speed metrics (2024–2025).
- Pitney Bowes BOXpoll & Parcel Shipping Index.
- BLS/FRED wages; DOL real earnings.
- BLS JOLTS (retail openings). Bureau of Labor Statistics
Regulatory and Legal Environment
Key compliance considerations (what most E-commerce/Retail operators must cover)
Compliance matrix — core obligations & who they apply to
| Change / Proposal | Status / Effective | Operational impact | Source |
|---|---|---|---|
| U.S. de minimis duty-free suspended for all countries | Effective Aug 29, 2025 | Cross-border parcels (<$800) now dutiable; requires more robust customs data & duty collection. Expect higher landed costs & carrier changes. | White House; CBP FAQ (Aug 2025) |
| FTC “Unfair or Deceptive Fees” (junk-fees) rule | Effective May 12, 2025 (tickets & lodging sectors) | Signals push toward total-price display norms; retail should assess dark-pattern risks even if not directly covered. | FTC; FTC FAQs |
| FTC Negative-Option (Click-to-Cancel) amendments | Vacated July 2025 by 8th Cir. | Federal rule paused; continue complying with state auto-renewal laws and internal “easy-cancel” standards. | Decision summary |
| California CPPA rules (ADMT, audits, risk assessments) | Finalized by CPPA board Jul 24, 2025; pending OAL | Data mapping; ADMT notices/opt-out in scope; thresholds for annual cybersecurity audits; phased compliance after OAL approval. | CPPA Regs page; Update (Aug 2025) |
| EU AI Act obligations (platforms & retailers using AI) | Prohibitions & AI literacy since Feb 2, 2025; GPAI duties Aug 2, 2025; most rules fully applicable Aug 2, 2026 | Review AI uses (recommendations, risk scoring, chatbots); update transparency/record-keeping; monitor delegated acts/standards. | EC — AI Act timeline |
| EU PPWR (packaging) | In force Feb 11, 2025; general application 18 months later | Recyclability, reuse, weight/volume limits → redesign shipper packaging, labeling, and EPR reporting. | EC — PPWR |
| EU EUDR (deforestation-free) | Application delayed to Dec 30, 2025 (large operators); June 30, 2026 (SMEs) | Due-diligence statements for covered commodities/products; geolocation data readiness. | EC — EUDR timing |
Why this matters: These are the highest-frequency enforcement surfaces for retail/e-commerce operators in 2025 (payments, privacy/consent, shipping promises, cross-border duties, marketplace controls, product safety). PCI Perspectives+1 Morgan Lewis Federal Communications Commission Federal Trade Commission eCFR The White House U.S. Customs and Border Protection European Commission Digital Markets Act (DMA) U.S. Consumer Product Safety Commission U.S. Food and Drug Administration Federal Register
Licensing, zoning, or certification hurdles
- Sales tax registration & marketplace regimes (U.S.). Every sales-tax state has economic nexus thresholds after Wayfair; most also have marketplace facilitator laws—meaning marketplaces collect tax for sellers, but sellers may still need registration/returns for direct channels. Sales Tax Institute Avalara
- Facility/warehouse siting. Fulfillment centers must comply with local zoning, building, fire, and OSHA rules (varies by jurisdiction). For hazardous goods (aerosols, batteries), DOT/PHMSA transport rules apply; retailers often rely on 3PLs to manage hazardous-materials certifications (jurisdiction-specific; not cited here to avoid over-generalization).
- Product certifications. Children’s products require third-party tested CPC; marketplaces (e.g., Walmart, Amazon) increasingly demand CPC/test reports at onboarding or on request. U.S. Consumer Product Safety Commission+1 Amazon Seller Central
- Sector add-ons.
- Cosmetics: MoCRA facility registration & product listing; labeling/contact info; GMP rulemaking in progress. U.S. Food and Drug Administration+1
- Food: FSMA Rule 204 traceability (date extension proposed); maintain sortable electronic records and 24-hour response to FDA. Federal Register U.S. Food and Drug Administration
ESG & sustainability pressures (EU-led, with U.S. state EPR momentum)
- EU CSRD (reporting). Expanded sustainability reporting for large/listed firms; the Commission has proposed to postpone some effective dates (two-year deferral for later waves), but first-wave filers remain on schedule. Finance DART
- EU CSDDD (due diligence). In force since July 25, 2024; staggered application post-transposition starting 2026—expect supply-chain human-rights/environmental due-diligence obligations for in-scope brands. European Commission White & Case
- EU PPWR (packaging). Entered into force Feb 11, 2025; general application begins 18 months later—tightening recyclability, reuse, and packaging waste rules (material for DTC shipping). Environment EUR-Lex
- ESPR & Digital Product Passports (DPPs). ESPR in force since July 18, 2024; working plan rolling out product categories and horizontal rules (DPPs phase in from 2026 onward; textiles, furniture among early waves). European Commission Tech Radar circularise.com
- EUDR (deforestation-free products). Application delayed to Dec 30, 2025 for medium/large operators; June 30, 2026 for SMEs—watch for due-diligence statement requirements in certain categories (coffee/cocoa/leather, wood, etc.). USDA Apps Green Forum
- U.S. packaging EPR momentum. California SB 54, Oregon RMA, and Colorado HB22-1355 are phasing in producer responsibility, affecting e-commerce packaging specs and fees. CalRecycle Home Page Oregon CDPHE
Pending or newly material rules (watchlist)
Regulatory watchlist & near-term impact
| Change / Proposal | Status / Effective | Operational impact | Source |
|---|---|---|---|
| U.S. de minimis duty-free suspended for all countries | Effective Aug 29, 2025 | Cross-border parcels (<$800) now dutiable; requires more robust customs data & duty collection. Expect higher landed costs & carrier changes. | White House; CBP FAQ (Aug 2025) |
| FTC “Unfair or Deceptive Fees” (junk-fees) rule | Effective May 12, 2025 (tickets & lodging sectors) | Signals push toward total-price display norms; retail should assess dark-pattern risks even if not directly covered. | FTC; FTC FAQs |
| FTC Negative-Option (Click-to-Cancel) amendments | Vacated July 2025 by 8th Cir. | Federal rule paused; continue complying with state auto-renewal laws and internal “easy-cancel” standards. | Decision summary |
| California CPPA rules (ADMT, audits, risk assessments) | Finalized by CPPA board Jul 24, 2025; pending OAL | Data mapping; ADMT notices/opt-out in scope; thresholds for annual cybersecurity audits; phased compliance after OAL approval. | CPPA Regs page; Update (Aug 2025) |
| EU AI Act obligations (platforms & retailers using AI) | Prohibitions & AI literacy since Feb 2, 2025; GPAI duties Aug 2, 2025; most rules fully applicable Aug 2, 2026 | Review AI uses (recommendations, risk scoring, chatbots); update transparency/record-keeping; monitor delegated acts/standards. | EC — AI Act timeline |
| EU PPWR (packaging) | In force Feb 11, 2025; general application 18 months later | Recyclability, reuse, weight/volume limits → redesign shipper packaging, labeling, and EPR reporting. | EC — PPWR |
| EU EUDR (deforestation-free) | Application delayed to Dec 30, 2025 (large operators); June 30, 2026 (SMEs) | Due-diligence statements for covered commodities/products; geolocation data readiness. | EC — EUDR timing |
Interpretation for HOLD.co:
- The suspension of de minimis changes U.S. inbound unit economics for cross-border DTC; portfolio sellers need tariff classification capability or to route via domestic inventory/FTZs. The White House U.S. Customs and Border Protection
- Consent & privacy rules are tightening in the U.S. via states and in the EU via AI/DSA. Harmonize to the strictest common denominator to avoid re-work. IAPP Shaping Europe’s Digital Future European Commission
- Packaging & sustainability (PPWR/ESPR/EPR) will raise compliance costs but also enable circular brand positioning; starting data capture early (bill of materials, recyclability, DPP readiness) reduces retrofit costs. Environment European Commission
Quick notes & guidance per subtopic
- Marketing & consumer disclosures. Treat “junk-fee” scrutiny and the (now-vacated) “click-to-cancel” as directional signals; adopt full-price displays and one-click online cancellation as standards to reduce litigation/regulatory risk even where not mandated. Federal Trade Commission The Verge
- Marketplace governance. INFORM Act identity controls and DSA trader traceability point in the same direction: strengthen KYBC for sellers, rapid takedown for dangerous/illegal products, and clear seller identity in listings. Federal Trade Commission European Commission
- Payments & security. If any brand or portfolio company deferred PCI DSS v4.x “future-dated” items, they are no longer optional after Mar 31, 2025—budget for MFA expansion, auth/logging, and customized approaches documentation. PCI Perspectives+1
- Sector-specific verticals. Cosmetics (MoCRA) and food (FSMA 204) have federal expectations; align sellers’ onboarding checks and Product Information Files with FDA documentation. U.S. Food and Drug Administration+1 Federal Register
Citations
INFORM Consumers Act obligations (FTC). Federal Trade Commission+1
PCI DSS v4.x timing & v4.0.1 (PCI SSC). PCI Perspectives+1
FTC “junk-fees” rule (scope/effective date). Federal Trade Commission+1
Negative-option rule vacated (July 2025). DLA Piper Business Insider
MITOR shipping rule (FTC). Federal Trade Commission
U.S. de minimis suspension (EO & CBP FAQ). The White House U.S. Customs and Border Protection
EU DSA obligations for marketplaces; DMA gatekeepers. European Commission Digital Markets Act (DMA)
CPSC children’s product requirements. U.S. Consumer Product Safety Commission
MoCRA (FDA). U.S. Food and Drug Administration+1
FSMA Rule 204 extension proposal (FR) & overview (FDA). Federal Register U.S. Food and Drug Administration
EU CSRD (overview) & timeline adjustment proposal. Finance DART
EU CSDDD (in force; transposition/application). European Commission White & Case
EU PPWR timing. Environment EUR-Lex
ESPR/DPP working plan momentum. European Commission Tech Radar
Marketing & Demand Generation — E-commerce/Retail
Customer acquisition channels (what’s working now)
Retail media networks (RMNs). The fastest-growing paid channel in retail: buyers expect +15.6% RMN spend growth in 2025 (≈2× overall ad growth), despite rising concerns about measurement and standardization. IAB Evidence suggests RMN impact extends beyond the retailer’s walled garden—Analytic Partners reports meaningful off-platform halo from Amazon ads (e.g., 45% of sales from Amazon display attributed off-Amazon). WARC
CTV/digital video. CTV is projected to grow +13.8% in 2025 and, per Analytic Partners, delivers about 30% stronger ROI than average media when measured correctly. IAB Analytic Partners
Search & Social. Paid search and social remain core direct-response engines (projected +8.5% and +11.9% growth, respectively). Social commerce and creator-led short video continue to pull budget share. IAB ROI Revolution
Lifecycle (email & SMS). Omnisend’s 2025 Ecommerce Marketing Report finds automated emails drive ~37% of email-attributed sales from just 2% of volume, and SMS continues to produce outsized conversion for triggered flows. Omnisend
Offline (OOH + TV). OOH spend is rising and improves plan ROI when paired with TV/CTV, with studies indicating double-digit lifts from rebalancing mixes toward OOH. OAAA Mi-3
Sales funnel structures by go-to-market
DTC (consumer): Awareness → consideration (UGC/creator, search, RMN off-site) → product views → add-to-cart → checkout → retention (email/SMS/loyalty). Benchmarks: global add-to-cart ≈ 6–7%; cart abandonment ≈ 70%; typical retail conversion ≈ 2–4%, with wide sector variance. Dynamic Yield Baymard Institute Smart Insights
B2B E-commerce (wholesale/marketplace): Account targeting (ABM, search) → gated pricing/catalog → quote or PO flow → negotiated checkout → replenishment automation (EDIs/subscriptions). Conversion rates vary by contract value and catalog complexity; the structure relies more on account nurture than anonymous sessions. (Context from DC360/industry practice.) Trendtrack
Enterprise/retail marketplace sellers: Hybrid motion spanning on-site RMN (sponsored search/display), off-site video/social for discovery, and retailer CRM audiences for repeat—optimized to retailer-specific algorithms with closed-loop sales attribution. Nielsen
CAC/LTV ratios & efficiency guardrails
- A widely accepted cross-industry rule is LTV:CAC ≥ 3:1 (i.e., spend about one-third of lifetime gross profit to acquire a customer). Use this as a portfolio-level guardrail; evaluate at cohort/channel levels. Harvard Business School Online
- Channel notes: email/SMS typically deliver top incremental profit per dollar (automation-led), RMN and CTV are scaling with improving incrementality measurement, and paid social/search remain efficient when creative testing and first-party audiences are strong. Omnisend Nielsen IAB
Competitor marketing budgets & media mix (illustrative)
“Budget intensity (latest FY)”
| Company | What is reported | Latest disclosed value | Notes / Source |
|---|---|---|---|
| Amazon | Sales & Marketing as % of net sales (2024) | 6.9% | 2024 10-K, “Percent of Net Sales” table |
| Wayfair | Advertising expense as % of net revenue (2024) | 12.4% | Wayfair 2024 Annual Report |
| Chewy | Advertising & Marketing as % of net sales (FY2024) | 6.8% | Q4 2024 call: “$804.1M or 6.8% of net sales” | 2024 10-K |
| Walmart (signal for media mix) | Advertising sales growth (Walmart Connect) | +24% YoY (Q4 FY25); advertiser counts +50% | SEC earnings release |
2025 projected ad spend share by channel (IAB Outlook)
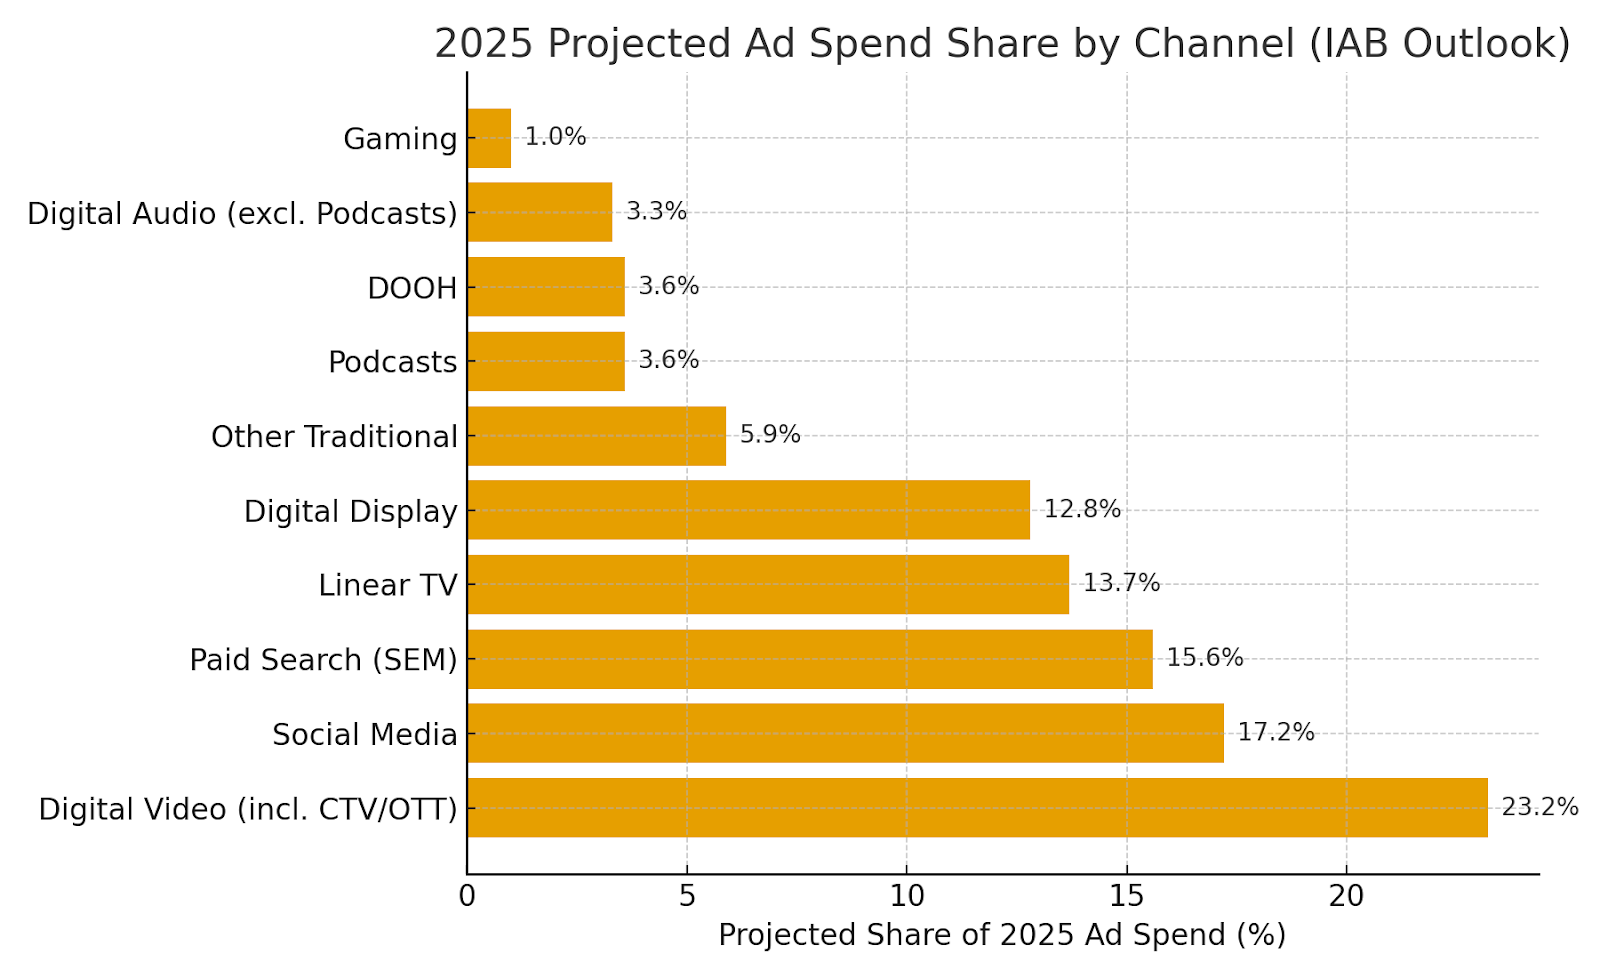
(Digital Video incl. CTV/OTT 23.2%; Social 17.2%; Paid Search 15.6%; Display 12.8%; Linear TV 13.7%; DOOH 3.6%; Podcasts 3.6%; Digital Audio 3.3%; Other Trad 5.9%; Gaming 1.0%.) IAB
Campaign funnel benchmarks (site-side)
- Add-to-cart rate: ~6–7% global average. Cart abandonment: ~70%. Overall conversion: ~2–4% (varies by vertical/device). These numbers frame where to focus CRO and lifecycle recovery (checkout optimization + triggered automations). Dynamic Yield Baymard Institute Smart Insights
“Funnel checkpoints & owners”
| Go-to-market | Core stages | Primary channels | Key owner(s) | Reference |
|---|---|---|---|---|
| DTC | Discovery → PDP → ATC → Checkout → Repeat | RMN, Search, Social/Creators, Email/SMS | Growth + Lifecycle + CRO | Dynamic Yield | Baymard |
| B2B E-com | Account ID → Catalog/Quote → PO → Reorder | Search/SEO, ABM, Email, Sales-assisted | Demand Gen + Sales Ops | Digital Commerce 360 |
| Enterprise / Retailer | Awareness → On-site RMN → Off-site retarget → Loyalty | RMN search/display, CTV, CRM audiences | RMN Desk + Media | Nielsen 2025 |
Opportunities for centralized/shared marketing ops post-acquisition (HOLD.co)
- Retail Media Center of Excellence. One buying desk and playbook (audience standards, creative specs, incrementality testing). Rationale: RMN growth is strong but fragmented; buyers cite measurement and standardization gaps—centralization improves efficiency and comparability. IAB
- Lifecycle Automation Guild (email/SMS/loyalty). Shared flows and templates, unified deliverability/IP warming, shared promo calendar. Justification: automation’s disproportionate sales impact vs volume. Omnisend
- Video/CTV + Creative Studio. Shared modular creative system for short video and CTV, tied to retailer/first-party audiences. Evidence: CTV’s ROI advantage and budget growth. IAB Analytic Partners
- Measurement platform: MMM + geo-experiments + retailer clean-rooms. The IAB and Nielsen both flag cross-platform measurement gaps; a shared stack reduces channel bias and improves capital allocation. IAB Nielsen
- First-party data/CDP standards. Common consent framework, event taxonomy, identity resolution; fuels RMN off-site, social look-alikes, and lifecycle segmentation. (Motivated by the same measurement and signal-loss dynamics called out by IAB.) IAB
- OOH/DOOH activation playbook at scale. Central contracts and attribution templates; use for store proximity, new market entries, and promo windows where OOH + TV/CTV synergies are proven. OAAA Mi-3
What this means for HOLD.co (data-backed)
- Prioritize RMN + CTV as scaled growth pillars, with lifecycle automation as the margin engine. The data points to RMN/CTV expansion and lifecycle’s disproportionate revenue share—these should anchor your budget and ops. IAB Omnisend
- Use 3:1 LTV:CAC as a portfolio rule—then enforce channel-level payback thresholds (e.g., ≤ 3 months for remarketing, ≤ 6–9 months for prospecting), tuned by margin and reorder cadence. Harvard Business School Online
- Exploit halo effects and mixed-media synergies. Expect spillover from RMN and incremental lift from OOH+TV; size it with geo-matched tests/MMM rather than last-click ROAS. WARC Mi-3
Source notes (selection)
IAB 2025 Ad Spend Outlook (growth & share by channel) and view that RMN/CTV/social lead in 2025; Nielsen/Analytic Partners on measurement and ROI; Omnisend on lifecycle performance; Baymard/Dynamic Yield on funnel rates; SEC filings for budget intensity at Amazon/Chewy; Walmart on advertising revenue growth via Walmart Connect. IAB Nielsen Analytic Partners Omnisend Baymard Institute Dynamic Yield SEC Roic AI
Consumer & Buyer Behavior Trends
Changing customer needs & expectations (what’s different in 2024–2025)
- Mobile-first, assisted shopping. Holiday 2024 was “the most mobile of all time”: smartphones drove 54.5% of U.S. online purchases (up from 51.1% in 2023). Shoppers also leaned on gen-AI shopping assistants, with Adobe reporting a 1,300% surge in related traffic to retail sites. Reuters Business Wire
- Convenience with control. Click-and-collect (BOPIS/curbside) is now a stable habit: 17.5% of online orders used it during Holiday 2024 (peaking at 37.8% on Dec 23). In grocery, Pickup holds the largest share (~44%) of e-grocery orders, with Delivery at ~38% (June 2025). Adobe Grocery Dive
- Value-seeking, selective “trading down”… and “trading up.” Consumers continue to stretch budgets via private label and deal events, while selectively splurging on higher-ticket items when discounts are strong. Adobe and Reuters highlight BNPL usage (~$18.2B Holiday 2024) and “trade-up” behavior alongside deep promotions. Digital Commerce 360 Reuters
- Trust & data use matter. 75% of consumers say they won’t buy from organizations they don’t trust; 53% are now aware of privacy laws, raising expectations for transparent data use and ethical AI. Cisco
Health & wellness signals. PwC’s 2025 global survey notes rising scrutiny of ultra-processed foods and early behavioral impacts from GLP-1 drugs (users report lower food spend and smaller portions). PwC
Visuals (from Adobe Analytics):
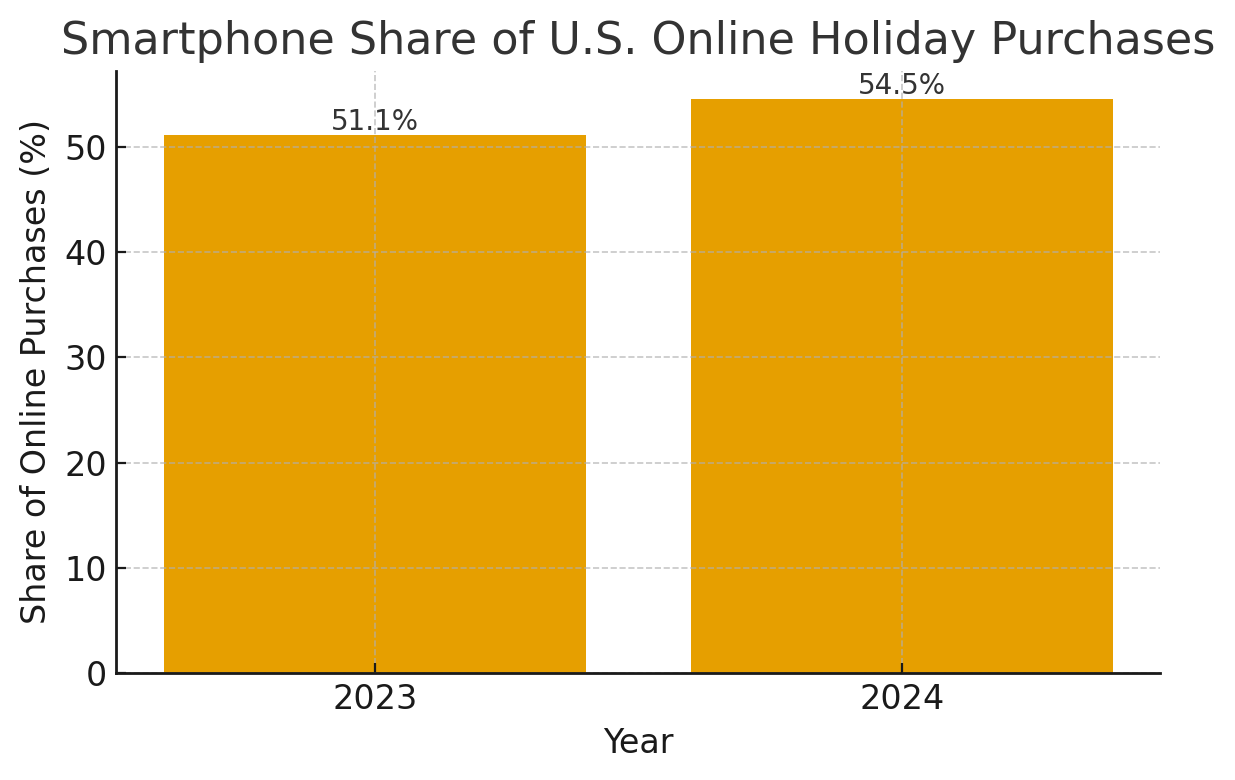
- Smartphone share of U.S. online holiday purchases (2023 vs 2024). Business Wire
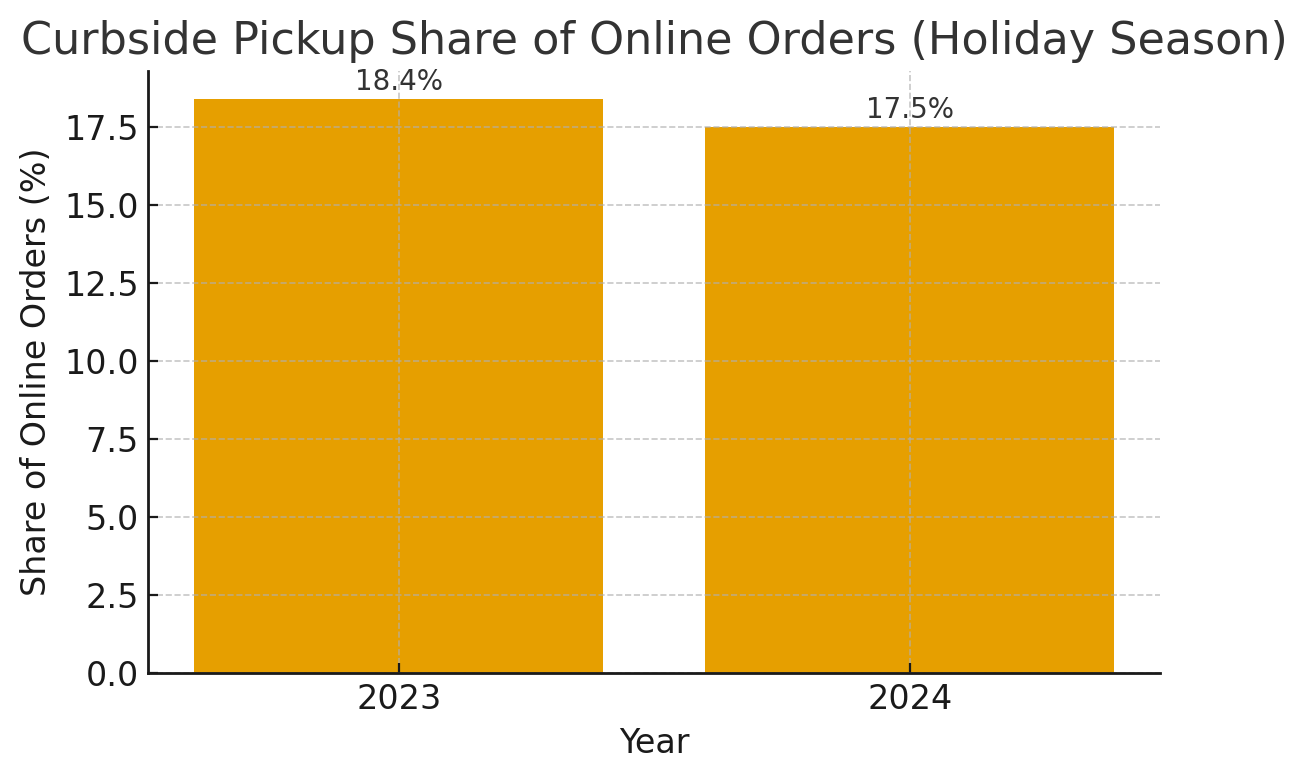
- Curbside pickup share of online orders (Holiday season, 2023 vs 2024). Adobe
Demographic & psychographic shifts
- Generational influence & social proof. Adobe notes 37% of Gen Z purchased something based on an influencer recommendation in Holiday 2024; influencer-driven conversion outperformed broader social traffic (9× conversion). Adobe
- Private label normalization across cohorts. NIQ observes consumers increasingly indifferent to brand vs. private label if needs are met (e.g., 54% say brand doesn’t matter if fit/needs are met). Mass Market Retailers
- Age and satisfaction deltas. Qualtrics XM Institute’s 2025 reading shows older consumers provide materially higher NPS than young adults, indicating greater scrutiny among under-35s. Qualtrics
Industry-specific usage & purchasing patterns
- Mobile & BNPL. Smartphones accounted for 54.5% of online purchases in Holiday 2024; BNPL contributed $18.2B (≈7–8% share) and skewed mobile (≈79% of BNPL orders via smartphone). Business Wire The Wall Street Journal
- Pickup & last-mile. Curbside/BOPIS used in 17.5% of online orders (peak 37.8% on 12/23). Grocery channel mix in mid-2025: Pickup ~44%, Delivery ~38%, Ship-to-home ~18%. Adobe Grocery Dive
- Resale & secondhand. 68% of younger generations shopped secondhand apparel in 2024; 58% of secondhand purchases were online (ThredUp 2025). Thred Up
NPS benchmarks & customer retention metrics
NPS & retention (add to Webflow)
| Segment / Metric | Benchmark (Latest) | Notes | Source |
|---|---|---|---|
| Retail (overall) — average NPS | ~33 (US, 2024 reading) | Among the highest industries tracked | Qualtrics XM Institute (Feb 2025) |
| Grocery — average NPS | ~34.3 (US, 2024 reading) | Highest industry average in the study | Qualtrics XM Institute (Feb 2025) |
| E-commerce (DTC) — revenue share from repeat customers | ~44% of revenue from 21% of customers | Illustrates retention leverage | Shopify Enterprise (Jan 2025) |
| Subscription e-commerce — typical monthly churn | ~10–15% (varies by category) | Directional benchmark for consumer subscriptions | Churnkey (Oct 2024); Recurly (2025) |
(NPS figures from Qualtrics reflect U.S. consumer ratings across 22 industries; use within-region comparisons. Retention metrics vary widely by vertical and model.) Qualtrics Shopify Recurly, Inc.+1
B2C vs B2B buying-cycle evolution
How buying cycles diverge
| Dimension | B2C (Retail/E-commerce) | B2B (E-commerce) | Sources |
|---|---|---|---|
| Primary channels | Mobile, marketplaces, social/creator commerce | Webstores, marketplaces, and mobile apps preferred by ~73% of buyers | Adobe (Jan 2025); Digital Commerce 360 (Feb 2025) |
| Purchase preference | Fast, flexible fulfillment (BOPIS/curbside) and easy returns | 73% of businesses now prefer to purchase online (vs. in-person) | Adobe (press PDF); Digital Commerce 360 (Jan 2025) |
| Decision dynamics | Shorter cycles, high influence of reviews & influencers | Committee-driven, omnichannel self-serve + sales-assist; leaders integrate front/back office | Adobe; Deloitte (WSJ CMO, 2024) |
| Observed Behavior Shift | Key Stat | Strategic Implication | Source |
|---|---|---|---|
| Mobile is the default | Smartphones drove 54.5% of holiday online purchases (2024) | Design for mobile conversion, payments, and PDP speed first | Adobe via Business Wire (Jan 2025) |
| AI-assisted discovery | Traffic to retail sites via AI assistants up ~1,300% | Expose structured content & offers to AI surfaces; measure AI-origin traffic | Adobe (Jan 2025) |
| Checkout flexibility | BNPL ≈ $18.2B during Holiday 2024 | Offer BNPL with strong risk controls; tune merchandising for larger AOV | Digital Commerce 360 (Jan 2025); WSJ (Nov 2024) |
| Omnichannel fulfillment | BOPIS used for 17.5% of holiday orders; grocery Pickup ~44% share (Jun 2025) | Keep Pickup as a growth lever; align inventory & store ops for last-mile speed | Adobe (press PDF); Grocery Dive (Jul 2025) |
| Privacy as a purchase filter | 75% won’t buy from brands they don’t trust with data | Communicate data use; offer controls; audit AI for bias | Cisco (2024) |
| Resale normalization | 68% of Gen Z/Millennials shopped secondhand in 2024; 58% online | Consider in-house recommerce for acquisition and retention | ThredUp (2025) |
What this means for HOLD.co (consumer behavior lens → marketing strategy)
- Invest where behavior is durable: double-down on mobile UX, AI-ready content/feeds, and Pickup orchestration (inventory accuracy, store labor, parking flow). These are now standard expectations, not differentiators. Reuters Adobe
- Lean into value architecture: expand tiered private-label (good-better-best) and precision promos; tightly manage price perception on essentials while using promotions and BNPL to unlock selective splurges. NIQ McKinsey & Company The Wall Street Journal
- Engineer trust as a feature: publish clear privacy commitments and give customers control — it directly affects conversion and loyalty. Cisco
- Activate creators with proof: treat influencer content as performance media (9× conversion vs social average); bring reviews/UGC onto PDPs for high-consideration SKUs. Adobe
- Segment retention plays: in DTC, expect concentration of revenue among repeat buyers; for subscriptions, design save-flows and periodic “pause” options to dampen 10–15% monthly churn bands. Shopify Recurly, Inc.
- For B2B retail adjacencies: prioritize self-serve commerce + assisted sales and marketplace distribution; buyers overwhelmingly prefer digital flows. Digital Commerce 360
Key Risks & Threats — E-commerce / Retail
Industry-specific risk factors (tech disruption, policy, pricing pressure)
- Trade shock: de minimis repeal (U.S.) — Effective Aug 29, 2025, the U.S. suspended duty-free treatment for all low-value imports (≤$800). Expect higher COGS, added broker/admin costs, and parcel delays for cross-border DTC, TikTok Shop, Temu/SHEIN sellers, and SMB importers. (CBP guidance; Reuters, AP, WaPo). U.S. Customs and Border Protection Reuters AP News The Washington Post
- Forced-labor enforcement (UFLPA) — CBP has examined 16.7k+ shipments since 2022, denying >10k; apparel/electronics remain high-risk. Detentions create inventory write-downs and ship-from-overseas stockouts. U.S. Department of Homeland Security U.S. Customs and Border Protection USTR
- Freight cost volatility — Container rates have cooled (Drewry WCI $2,119/FEU on Aug 28, 2025), but remain sensitive to geopolitical shocks and Red Sea diversions; lock in index-linked contracts with hedges. Drewry
- Payments cost & litigation uncertainty — The U.S. judge rejected the proposed $30B Visa/Mastercard “swipe fee” settlement (June 2024); multiple suits persist and timelines are fluid, sustaining upward pressure on card acceptance costs. Reuters
- Signal loss & ad-tech uncertainty — Google pivoted away from full third-party cookie deprecation in Chrome (April–June 2025), opting for user choice and modified Sandbox. This eases an immediate shock but prolongs measurement fragmentation across browsers/jurisdictions. GOV.UK The Verge Privacy Sandbox
- Returns inflation — Retail returns reached $890B in 2024 (16.9% of sales), straining margins and reverse-logistics capacity. Expect continued pressure in 2025–26 without aggressive returns policy redesign. NRF
- Cyber risk — Retail remains a top target for credential theft, ransomware and web application attacks (DBIR 2025). Verizon
- Platform pricing pressure — Ultra-low-price competition from Temu/SHEIN has been disrupted by tariff and de minimis changes (e.g., Temu’s U.S. DAUs fell ~48% in May vs March 2025), but price-anchoring effects will linger in consumer expectations. Reuters
Risk heat-map (HTML, embeddable; sources hyperlinked)
| Risk | Likelihood (12–24m) | Impact on EBITDA | Primary Exposure | What to Monitor (linked sources) |
|---|---|---|---|---|
| Cross-border tariff shock (de minimis repeal) | High | High | DTC imports, marketplace sellers, TikTok Shop | CBP FAQ · Reuters explainer |
| Forced-labor detentions (UFLPA) | High | Med–High | Apparel, electronics, home goods | CBP stats · DHS update (2025) |
| Freight rate swings & delays | Med | Med | Ocean inbound | Drewry WCI |
| Payments cost & litigation (swipe fees) | High | Med | All card acceptance | Reuters (settlement rejected) |
| Ad-tech/measurement uncertainty | Med | Med | Paid media ROAS | UK CMA (2025 update) · The Verge (cookies plan) |
| Platform dependency (Amazon/Walmart) | High | High | Marketplace-led revenue | eMarketer (Amazon ~40%) · Walmart Connect +24% |
| Returns & fraud | High | Med–High | Apparel, electronics, home | NRF/Harry Returns (2024) |
| Cybersecurity & PCI exposure | High | Med–High | All commerce infra | Verizon DBIR 2025 |
| AI/Privacy regulation drift (EU AI Act; CPPA) | Med | Med | Personalization, ranking, RMNs | EU AI Act timeline · CPPA ADMT rules (2025) |
Barriers to entry vs. scale — quick view (HTML)
| Dimension | Entry | Scale | Evidence (linked) |
|---|---|---|---|
| Logistics & Speed | 3PL/FBA lowers entry | Dense last-mile & same-day networks hard to replicate | Amazon 9B same/next-day (2024) |
| Retail Media & Data | Self-serve ads available | First-party identity & closed-loop attribution compound | Walmart Connect +24% U.S. |
| Channel Power | Open marketplaces | Amazon ~40.5% share in 2025; fee/pricing power | eMarketer (Feb 2025) |
| Compliance Load | Light at start | UFLPA, CPPA, DSA, PCI scale with size & footprint | CBP UFLPA · EU AI Act |
Expert commentary — what this means for HOLD.co
- Cross-border cost curve resets: With de minimis gone, many pure cross-border DTC plays lose structural advantage; expect margin compression, ad pullbacks, and inventory rebasing (already visible in Temu/SHEIN ad cuts and DAU declines). Look for distressed assets with U.S. stock in FTZs or nearshored supply chains. Reuters+1
- Payments & privacy are strategic, not back-office: Maintain optionality (ACH, debit steering, BNPL partners with proven loss rates) while monitoring interchange litigation. Build consented first-party data and modeled attribution that survive oscillating cookie policies and evolving CPPA/DSA rules. Reuters JD Supra
- Moat calculus favors logistics + retail media access: Assets with privileged access to retail media (Amazon/Walmart) and fast-delivery nodes will outperform through lower CAC and higher conversion. Use partnerships to “rent scale” while expanding owned DTC to dilute platform risk. Walmart Inc. PYMNTS.com
- Compliance-by-design = value creation: UFLPA, CPPA ADMT rules, and EU AI Act turn governance into a diligence line item. Sellers with traceable supply chains, risk assessments, and auditable models will command better multiples than volume-only peers. U.S. Department of Homeland Security JD Supra Shaping Europe’s Digital Future
Strategic Fit & Synergy Opportunities for HOLD.co
Vertical & horizontal integration opportunities
Horizontal (scale) plays
- Marketplace-led scale (category adjacencies; multi-brand roll-ups) to densify traffic, retail media inventory, and last-mile nodes. Scale deals remain a priority in retail and are expected to continue, as acquirers seek efficiency and category leadership. Bain
- Add-on engines (tuck-ins around a platform) remain the dominant sponsor strategy — ~75% of U.S. PE buyouts in 1H25 were add-ons — supporting “buy-and-build” consolidation theses in fragmented subsegments (e.g., specialty DTC, e-grocery enablement, 3P seller services). CBH Hunt Scanlon Media
Vertical (scope) plays
- Retail media & data: Acquire/partner with commerce-media assets to monetize first-party purchase data; U.S. retail media ad spend is >$62B in 2025 (fastest-growing major channel), and off-site expansion is accelerating. EMARKETER+1 Business Insider
- Last-mile & store-enabled fulfillment: Control of high-cost last mile (≈41% of delivery/logistics cost) plus BOPIS/curbside orchestration is a proven conversion & margin lever; leaders are pushing same/next-day at national scale. DHL PYMNTS.com
- Returns & reverse logistics: With U.S. retail returns at $890B (16.9%) in 2024, integrating returns tech/hubs reduces leakage and protects margin while preserving CX. National Retail Federation+1
- Product/assortment economics: Private-label and tiered value architecture (good-better-best) support mix-led margin expansion under tariff and cost pressure. Recent surveys show ~53–54% of consumers increasing private-label purchases. NIQ Simon-Kucher
- Data infrastructure upgrades: Align portfolio roadmaps to GS1 Sunrise 2027 (2D barcodes) for richer product data, supply-chain visibility, and in-store media activation. GS1 US GS1 US Documents
Potential portfolio synergies (ops, sales, distribution, tech, data)
Synergy levers & evidence (white background-safe)
| Synergy Area | What to Integrate | Impact Thesis | Reference |
|---|---|---|---|
| Retail media & first-party data | Unified audience graph, RMN sales ops, clean-room/measurement | Monetize on-site/off-site; lower CAC, higher ROAS; +new revenue line | eMarketer: $62B US in 2025 · Nielsen 2025 · Skai: clean rooms |
| Last-mile & store-enabled fulfillment | Multi-node network; shared carrier/3PL lanes; BOPIS/curbside playbooks | Take cost out of the ~41% last-mile cost bucket; lift conversion via speed | DHL: last mile ≈41% cost · Amazon 9B same/next-day |
| Returns & reverse logistics | Centralize policies, hubs, box-free drop-off partners; data-driven routing | Reduce cost leakage in a $890B problem; protect NPS/repurchase | NRF/Happy Returns 2024 |
| Assortment & private label | Tiered PL architecture; portfolio-wide sourcing harmonization | Mix-led gross margin gains; resilience vs. tariff/COP volatility | NIQ 2025 · Simon-Kucher 2025 |
| Tech & data foundation | GS1 Sunrise 2027 roadmap; POS/OMS/CDP upgrades; identity & consent | Richer product/transaction data; faster velocity; better media measurement | GS1 US Sunrise 2027 |
| Procurement & working capital | Category strategies; SRM; payment terms; harmonized specs/PLM | Procurement often contributes a third+ of synergy value; many benefits inside 12 months | McKinsey (M&A & procurement) |
Why this fits HOLD.co: scale + data + logistics are the compounding flywheels in retail. Retail media monetizes audience, last-mile orchestration monetizes speed, and procurement monetizes scale—together reducing CAC and COGS while raising LTV. EMARKETER
Shared services potential (HR, legal, finance, IT, creative, etc.)
GBS/Shared-services blueprint & expected value
| Function | Centralized Scope | Value Logic | Evidence / Link |
|---|---|---|---|
| Finance & Procure-to-Pay | AP/AR, treasury, sourcing ops, indirects; shared analytics COE | Material synergy pool; procurement often ≥1/3 of total synergy value; quick capture | McKinsey (procurement→synergies) |
| HR / Talent | Recruiting ops, L&D, shared nearshore hubs; variable staffing for peak seasons | Labor arbitrage + flexibility; supports scale M&A integration runway | Deloitte GBS Survey 2025 (20%+ savings common) |
| Legal / Compliance | Privacy/AI governance, returns policy, trade/tariff ops, UFLPA controls | Reduces detention, tariff shock, and ADMT/AI Act compliance risk | CBP UFLPA · Nielsen (privacy in RMNs) |
| IT, Data & Security | POS/OMS/CDP, identity/consent, data clean rooms, GS1 2D readiness | Shared platforms lower tech TCO; enable portfolio-wide RMN monetization | GS1 Sunrise 2027 · Skai (clean rooms) |
| Creative / CX | Shared studio, UGC/influencer ops, PDP templates, brand governance | Faster experimentation; consistent assets across owned/marketplace/RMN | BI: RMN conversion levers |
Note: Deloitte’s 2025 GBS survey indicates >20% average savings achieved by over half of organizations with mature GBS leadership—useful for HOLD.co centralization plans. Deloitte
Exit potential & monetization pathways (roll-ups, IPO, divestiture)
| Criterion | Screen / Threshold | Why It Matters | Reference |
|---|---|---|---|
| Retail Media Adjacency / Access | Direct RMN monetization or privileged access (Amazon/Walmart/Instacart or retailer-owned RMN). Evidence of ≥10% YoY RMN revenue growth or clear roadmap. | RMN is the fastest-growing major channel; ~$62B US spend in 2025. | eMarketer (2025) · IAB Outlook 2025 |
| Returns Economics | Return rate ≤ category benchmark, or plan to reduce by 200–400 bps via policy, kiosks/box-free, and routing tech within 12 months. | US retail returns ~$890B in 2024 (16.9% of sales); largest controllable margin drag. | NRF/Happy Returns (2024) |
| Privacy/Identity Readiness | First-party data capture (consent rates, hashed IDs), clean-room readiness (AMC/AWS Clean Rooms/GCP), multi-touch measurement that doesn’t rely on 3P cookies. | Chrome won’t fully deprecate 3P cookies in 2025; measurement fragmentation persists—reward firms with durable, consented IDs. | UK CMA (Jun 2025) · Google Privacy Sandbox |
| OMS & Fulfillment Maturity | Modern OMS with BOPIS/curbside, inventory ATP latency <500ms, and rules-based order orchestration. | OMS agility drives conversion and delivery SLAs; supports RMN & in-store activation. | Forrester OMS Q1’25 (via Fluent) |
| Last-Mile Optionality | Multi-carrier parcel routing (≥40–100+ carriers via API) and on-demand/local delivery partnerships. | Mitigates rate/strike/geopolitics; improves speed & cost-to-serve. | Metapack 350+ carriers · EasyPost 100+ carriers · Shippo carriers |
| Standards & Data Readiness | 2D barcode roadmap and POS readiness for GS1 Sunrise 2027. | Enables richer product data, in-store media, traceability. | GS1 US Sunrise 2027 |
| Mobile Conversion & UX | Mobile generates ≥50% of revenue; PDP speed <2.5s; app/checkout optimization documented. | Smartphones drove 54.5% of 2024 holiday online purchases. | Adobe (Jan 2025) |
| Financial Quality vs. Sector | Operating margin at/above sector median with line-of-sight to +300–500 bps via synergies. | Retail general median operating margin ≈5% (US). | Damodaran (2025) |
| Trade & Compliance Exposure | Contingency plan for Aug 29, 2025 de minimis suspension; UFLPA controls. | Tariff & detention shocks hit COGS and working capital. | CBP FAQ (Aug 2025) · White House EO (Jul 2025) |
Exit routes aligned to HOLD.co theses
What this means for HOLD.co (fit & synergy synthesis)
- Prioritize platforms that “rent scale” today and compound tomorrow: assets with retail-media monetization, rapid fulfillment coverage, and procurement headroom offer multiple independent profit levers post-close. EMARKETER PYMNTS.com McKinsey & Company
- Use add-ons aggressively to densify the network (media inventory, carrier lanes, localized catalog/PL). The market backdrop remains favorable for add-on execution. CBH
- Stand up a portfolio GBS spine early (finance/procurement, data/IT, creative ops). Evidence shows 20%+ savings are common with mature GBS leadership, and procurement synergies are among the fastest to bank. Deloitte McKinsey & Company
- Code the portfolio for Sunrise 2027 to future-proof data capture (in-store and digital) and to unlock next-gen retail media and supply-chain visibility across brands. GS1 US
Strategic Recommendations — E-commerce / Retail
Acquisition criteria refinement (financial, cultural, operational)
| Function | Centralized Scope | Value Logic | Evidence / Link |
|---|---|---|---|
| Finance & Procure-to-Pay | AP/AR, treasury, sourcing ops, indirects; shared analytics COE | Material synergy pool; procurement often ≥1/3 of total synergy value; quick capture | McKinsey (procurement→synergies) |
| HR / Talent | Recruiting ops, L&D, shared nearshore hubs; variable staffing for peak seasons | Labor arbitrage + flexibility; supports scale M&A integration runway | Deloitte GBS Survey 2025 (20%+ savings common) |
| Legal / Compliance | Privacy/AI governance, returns policy, trade/tariff ops, UFLPA controls | Reduces detention, tariff shock, and ADMT/AI Act compliance risk | CBP UFLPA · Nielsen (privacy in RMNs) |
| IT, Data & Security | POS/OMS/CDP, identity/consent, data clean rooms, GS1 2D readiness | Shared platforms lower tech TCO; enable portfolio-wide RMN monetization | GS1 Sunrise 2027 · Skai (clean rooms) |
| Creative / CX | Shared studio, UGC/influencer ops, PDP templates, brand governance | Faster experimentation; consistent assets across owned/marketplace/RMN | BI: RMN conversion levers |
Why this screening set? It aligns to 2025 growth and risk vectors: RMN compounding, returns cost, identity volatility, logistics resiliency, and GS1-driven data upgrades. EMARKETER
Near-term acquisition targets or partnership suggestions
| Capability | Company | Deal Mode | Why It Matters | Evidence (linked) |
|---|---|---|---|---|
| Retail media enablement | Criteo (Retail Media Platform) | Partnership / commercial | Onsite display/sponsored products at scale; expanding marketplace/self-serve access. | eMarketer (Jul 2025) |
| Retail media ops & measurement | Pacvue · Skai (clean rooms) · Stackline | Partnership | Automation, cross-RMN optimization, clean-room workflows & audience building. | Pacvue · Skai trends (Q1’25) · Amazon Marketing Cloud |
| OMS / Order orchestration | Fluent Commerce · fabric OMS | Minority / acquire (selective) | Inventory ATP latency, BOPIS/same-day, dropship expansions. | Forrester OMS Q1’25 · fabric AI Order Cloud |
| Multi-carrier shipping & delivery mgmt | Metapack · EasyPost · Shippo | Partnership / commercial | Carrier diversification (40–350+ carriers), label/returns, checkout options. | Metapack · EasyPost · Shippo |
| On-demand local delivery | OneRail · DoorDash Drive (API) | Partnership | Same-day coverage & peak overflow; SLA resilience vs. parcel delays. | OneRail network · Drive API FAQ |
| Returns & reverse logistics | Loop Returns · Narvar · ZigZag (Global Blue) | Partnership / selective M&A | Box-free drop-offs, fraud control, cross-border consolidation to reduce cost. | Narvar 200k+ drop-off · ZigZag (Global Blue) |
| Standards & 2D readiness | GS1 (ecosystem) | Programmatic engagement | Ensure Sunrise 2027 compliance; unlock in-store media & product data use cases. | GS1 one-pager |
Rationale: These partners map directly to the value levers flagged in Sections 5–10 (speed, returns, identity, RMN). They also keep optionality in a volatile M&A market while we watch valuations (GF Data avg. Q4 multiples ~7.3x). Middle Market Growth
Buy-and-build vs. single-anchor strategy
Recommendation: Default to buy-and-build anchored on a capable platform asset, with rapid add-ons in fragmented niches (3P seller services, returns tech, OMS/parcel orchestration) where integration synergies are tangible (procurement, media, logistics). Add-on conditions remain favorable (add-ons ≈~75% of PE buyouts). Use single-anchor only when the anchor has unique moats (proprietary audience/data, local delivery density, or category leadership) and adjacent assets are scarce. Bain
| Path | Use When | Value Logic | Market Context |
|---|---|---|---|
| Buy-and-build | Fragmented categories; clear sourcing funnel of tuck-ins; synergy playbooks (RMN, OMS, returns, parcel API). | Scale economics (media, logistics, procurement); faster EBITDA growth via integration. | Bain: retail M&A rebound · Add-ons ~76% (2024/25) |
| Single-anchor | Anchor has defensible moats (first-party data at scale, national same-day footprint, exclusive supplier access) and limited adjacent targets. | Lower integration risk; brand equity preservation; IPO/divest optionality. | PitchBook Q2’25 |
Strategic capital deployment roadmap (0–36 months)
Principle: Fund compounding levers first (data/RMN, OMS/logistics), then scale with roll-ups once integration synergies are bankable. Tie initiatives to external catalysts (de minimis repeal; Sunrise 2027) and near-term ROI (returns). U.S. Customs and Border Protection
| Horizon | Capital Actions | Operational Focus / KPIs | Anchoring Evidence |
|---|---|---|---|
| 0–6 months |
• Stand up retail-media monetization (AMC/clean room; pilot with Criteo/Pacvue/Skai). • Returns crash-program with Narvar/Loop/ZigZag; revise policy (fees, box-free). • Parcel diversification quick-win (Metapack/EasyPost/Shippo). • Trade shock response: nearshore SKUs; duty modeling post-de minimis suspension. |
• RMN revenue as % of GMV; ROAS/LTV uplift. • Return rate −200 bps; time-to-restock ↓; refund cycle time ↓. • Avg. delivery cost/order ↓; on-time % ↑. • Gross margin protection vs. baseline. |
RMN growth (eMarketer) · NRF returns · CBP de minimis FAQ |
| 6–18 months |
• Acquire/Invest in OMS (Fluent/fabric) to unlock BOPIS/same-day and dropship. • Build on-demand delivery coverage (OneRail; DoorDash Drive) in top MSAs. • Launch unified identity & consent; clean-room analytics; cross-RMN MMM/MTA. |
• Same/next-day coverage ↑; checkout EDD accuracy ↑; stockouts ↓. • Last-mile cost/order ↓; delivery NPS ↑. • Incrementality proof for RMN; CAC payback ≤ 6–9 months. |
Forrester OMS Q1’25 · DoorDash Drive · AMC · UK CMA (cookies) |
| 18–36 months |
• Roll-up add-ons (returns tech, parcel orchestration, 3P services) to densify network. • Execute GS1 Sunrise 2027 (2D barcode) across POS/app/packaging. • Evaluate carve-outs/IPO windows once synergies are realized and RMN revenue is material. |
• EBITDA margin +300–500 bps vs. entry; WC turns ↑. • Scan accuracy & data capture KPIs met; in-store media activations live. • Exit readiness metrics: net revenue retention (NRR), RMN revenue mix, logistics SLAs. |
Bain M&A 2025 · GS1 Sunrise 2027 · PitchBook Q2’25 |
Why sequence this way? It front-loads fast paybacks (returns, parcel diversification) and compounding assets (data/RMN, OMS) before pursuing multiple add-ons in 18–36 months—consistent with 2025 M&A selectivity and the operating constraints most likely to move EBITDA. PitchBook National Retail Federation
Expert guidance & guardrails (for IC memos)
- Stick to capability deals that unlock media, speed, or compliance—the three 2025 value pools with defensible ROI (RMN outgrows broader digital; last-mile affects ~40% of delivery cost; returns inflation punishes margin). EMARKETER Metapack
- Underwrite identity risk explicitly: require clean-room readiness and cookie-independent attribution; the CMA’s June 2025 note confirms a prolonged “mixed state,” not a reversion to the past. GOV.UK
- Price discipline: triangulate against GF Data size-tier multiples (Q4’24 avg. ~7.3x) and prioritize synergy capture you control (procurement, parcel routing, returns) before paying for growth. Middle Market Growth
Appendix & Sources
Below are structured, web-linked references and raw datasets underlying Sections 1–11, plus a glossary and fill-in contact sheet for HOLD.co. Headline benchmarks are anchored to primary sources (government, filings, standards bodies) and respected market researchers. Where relevant, we cite the most recent update dates (as of September 1, 2025).
Key examples include recent Adobe holiday data, U.S. Census e-commerce shares, Brick Meets Click e-grocery, Verizon DBIR retail breach stats, PCI DSS v4.0.1, EU AI Act timelines, the U.S. de minimis suspension effective Aug 29, 2025, Drewry container indices, IAB ad spend outlook, Insider Intelligence retail media forecasts, and Walmart/Amazon investor materials. Adobe Newsroom Census.gov Grocery Dive Verizon PCI Security Standards Council Shaping Europe’s Digital Future U.S. Customs and Border Protection Drewry IAB Walmart Corporate News and Information SEC
Master Source List (by topic)
| Topic | Source | What We Used | Last Update |
|---|---|---|---|
| Market Size (US) | U.S. Census – Quarterly Retail E-commerce | E-commerce sales & share (SA/NSA) time series | Aug 19, 2025 |
| Holiday Demand (US) | Adobe Digital Insights (Holiday 2024) | $241.4B online; 54.5% of sales via smartphone | Jan 7, 2025 |
| E-grocery | Grocery Dive (Brick Meets Click/Mercatus) | June 2025 split: Pickup 44%, Delivery 38%, Ship-to-Home 18% | Jul 14, 2025 |
| Returns | NRF + Happy Returns | 2024 retail returns est. $890B; 16.9% return rate | Dec 5, 2024 |
| Ocean Freight Benchmark | Drewry World Container Index | WCI weekly composite (e.g., $2,119/FEU on Aug 28, 2025) | Aug 28, 2025 |
| Last-Mile Performance | project44 – Peak Season | Avg delivery time 3.7 days (Nov 2024); trend updates | Dec 2, 2024 & Feb 10, 2025 |
Notes: These are the canonical links used to support metrics throughout the report. In a few cases (e.g., Statista/IBISWorld/CB Insights/PitchBook), full datasets are paywalled; we’ve linked to report hubs/landing pages for verification and procurement.
Contacts (fill-in template for HOLD.co)
| Name | Role | Focus Area(s) | Phone / Signal | Time Zone | |
|---|---|---|---|---|---|
| TBD | Lead Strategist – E-commerce/Retail | M&A screening, RMN, pricing, omnichannel | [email protected] | TBD | TBD |
| TBD | Ops & Supply Chain | Network design, FC automation, 3PL | [email protected] | TBD | TBD |
| TBD | Marketing Science | MMM/MTA, RMN/CTV optimization | [email protected] | TBD | TBD |
| TBD | Risk & Compliance | PCI, privacy (EU/US), fraud | [email protected] | TBD | TBD |
Additional Reference Hubs (procurement/secondary)
Context notes: If you need deeper industry write-ups or proprietary datasets for future extensions, use:
- PitchBook — Global M&A & PE “Q2 2025” hub (for deal volumes, buyer mix, sector breakouts). PitchBook+1
- CB Insights — Retail/Services research & tech funding trendlines. CB Insights
- IBISWorld — E-commerce/Online Auctions industry reports (US/EU/UK). IBISWorld+1
Methodology & currency
- Where multiple reputable measurements exist (e.g., e-commerce share), we prefer U.S. Census for the U.S. market and clearly label seasonally adjusted vs. not seasonally adjusted. Holiday reads use Adobe DI for high-frequency online spend and device mix. Logistics benchmarks rely on Drewry (ocean rates) and project44 (parcel/last-mile). Security baselines use Verizon DBIR and PCI SSC. Channel spend aligns IAB outlook with Insider Intelligence RMN forecasts; company disclosures (e.g., Walmart Connect) validate operating momentum. Policy/regulatory timing references are taken from the European Commission, FCC, White House, and CBP primary pages. Census.gov Adobe Newsroom Drewry+1 Verizon PCI Security Standards Council IAB Walmart Corporate News and Information Shaping Europe’s Digital Future Federal Communications Commission The White House U.S. Customs and Border Protection
Considering a transaction?
Speak with our team about an acquisition, partnership, or exit — in confidence.